Figures & data
Figure 1. Expression of GmDHN9 gene under abiotic stress. (a) 100 μM ABA; (b) 10% PEG6000; (c) 4°C; (d) 100 mM NaCl. * p < .05; ** p < .01. All bars represent means ±SD, (n ≥ 3).
Figure 2. Subcellular localization analysis of GmDHN9 proteins in tobacco cells. (Bars = 25 μm).
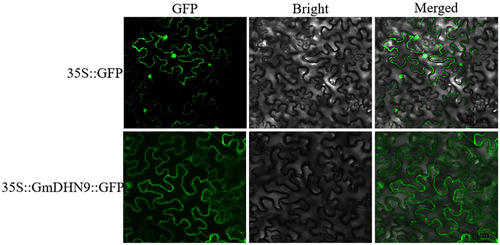
Figure 3. Detection of transgenic Arabidopsis. a: PCR detection of T1 generation transgenic Arabidopsis thaliana; b: fluorescence PCR detection of T3 generation transgenes. * p < .05; ** p < .01. All bars represent means ±SD, (n ≥ 3).
Figure 4. Determination of germination rate and root length of transgenic Arabidopsis thaliana. (a) germination rate phenotype; (b) root length phenotype; (c) germination rate statistics; (d) root length statistics. * p < .05; ** p < .01. All bars represent means ±SD, (n ≥ 3).
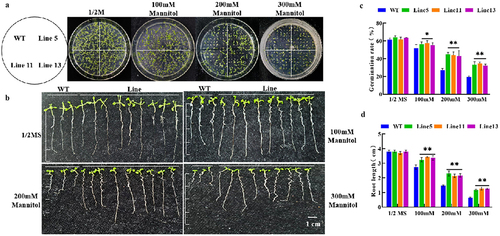
Figure 5. Phenotypic identification and determination of physiological and biochemical indexes of transgenic Arabidopsis thaliana. (a) rehydration experiment; (b) survival rate; (c) MDA content; (d) pro content; (e) chlorophyll content. * p < .05; ** p < .01. All bars represent means ±SD, (n ≥ 3).
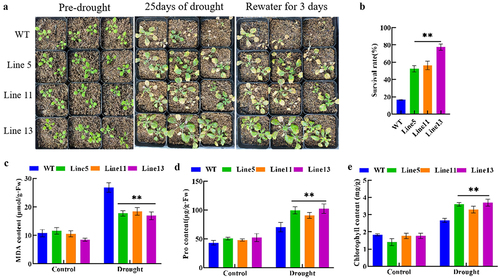
Figure 6. Detection of reactive oxygen species in transgenic Arabidopsis thaliana. (a) NBT staining; (b) DAB staining; (c) O2− detection; (d) H2O2 detection. * p < .05; ** p < .01. All bars represent means ±SD, (n ≥ 3).
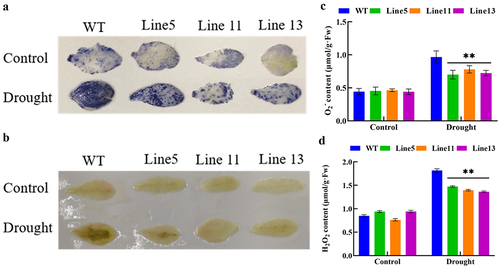
Figure 7. Detection of antioxidant enzyme activity in transgenic Arabidopsis thaliana. (a) POD activity; (b) SOD activity; (c) CAT activity. * p < .05; ** p < .01. All bars represent means ±SD, (n ≥ 3).
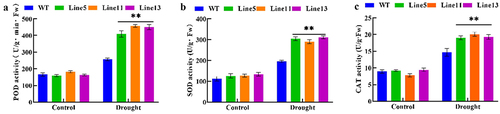
Figure 8. Detection of drought-resistant gene expression in T3 generation transgenic Arabidopsis thaliana. * p < .05; ** p < .01. All bars represent means ±SD, (n ≥ 3).
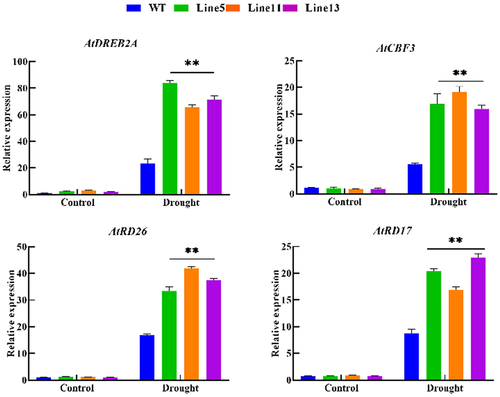
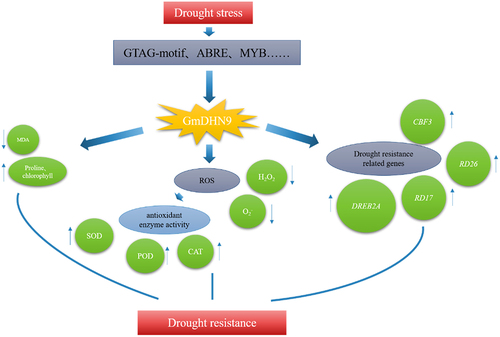
Figure 9. GmDHN9 gene mediates drought tolerance mechanism in Arabidopsis thaliana.