
Figures & data
Table 1. Disability milestones as defined by the Healthcare Common Procedure Coding System (Citation22).
Figure 1. Monthly costs to diagnosis for the pure Medicare population. Monthly costs were calculated as average monthly costs per patient. Index month (black square); 1–8 months before (grey diamonds); 9 + months before (black triangles).
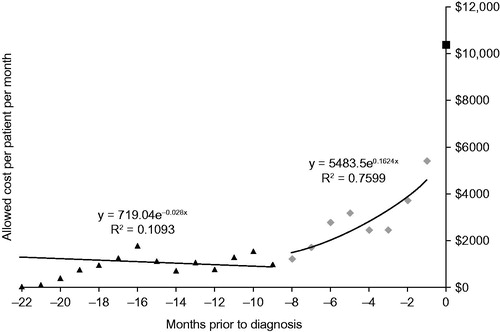
Figure 2. Total allowed costs after index date as a measure of survival time in a pure Medicare population.
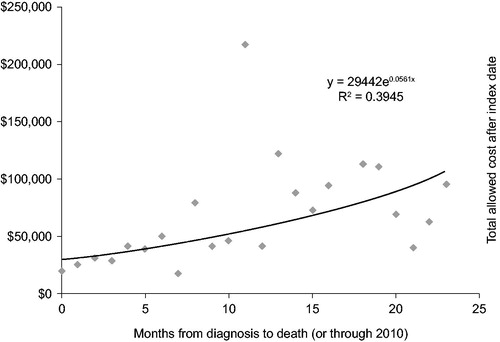
Table 2. Monthly costs per patient associated with ALS in the pure Medicare populationTable Footnote*.
Figure 3. Monthly costs to diagnosis for the pure commercial population. Monthly costs were calculated as average monthly costs per patient. Index month (black square); 1–8 months before (grey diamonds); 9 + months before (black triangles).
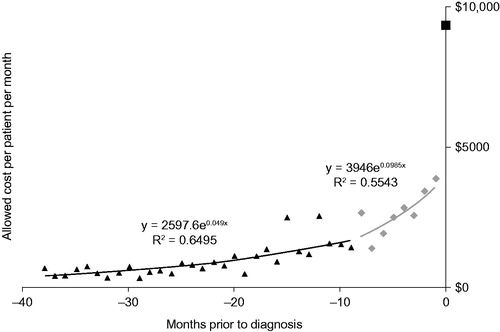
Table 3. Monthly costs per patient associated with ALS in the commercial populationTable Footnote*.
Figure 4. ALS costs during insurance transition. The light grey bars represent costs between coverage stages – for example, after diagnosis and until Medicare eligibility, or after getting eligibility.
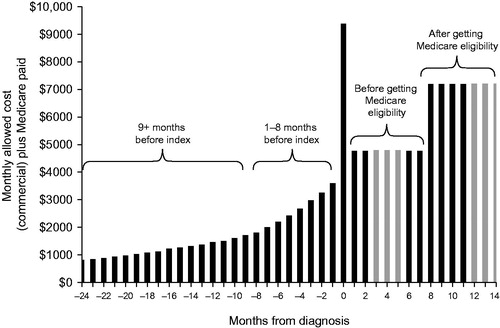
Figure 5. ALS costs before and after Medicare eligibility.
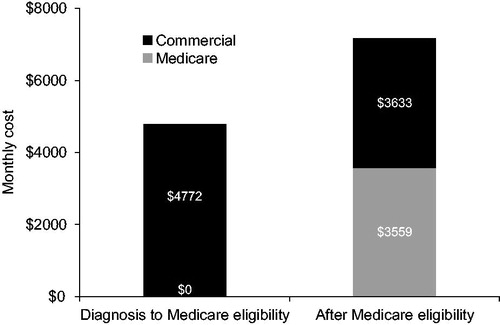
Table 4. Total costs from index date to disability milestones in pure Medicare casesTable Footnote*.