
Figures & data
Figure 1 Inclusion and exclusion criteria. We tried to make our study widely inclusive. Thus, unlike most ALS trials, we did not have exclusions related to disease duration, use of ventilators or feeding tubes.
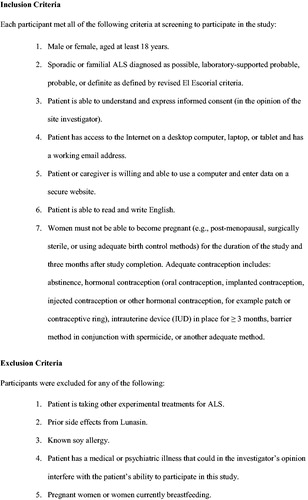
Figure 2 Participant flow. This figure shows the flow of participants through the study.
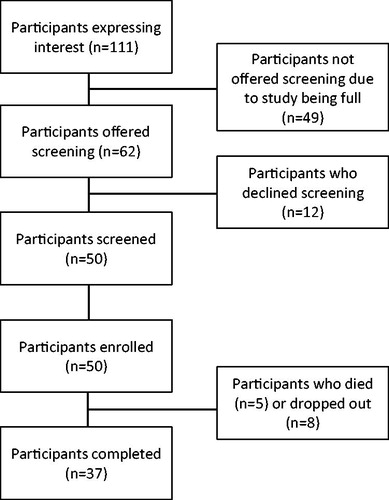
Table 1 Demographics of participants and “playing along at home” cohort.
Figure 3 ALSFRS-R progression. Monthly ALSFRS-R means and standard errors are shown for 47 available participants (red) and 141 historical controls (black). There was no difference in ALSFRS-R progression between these groups.
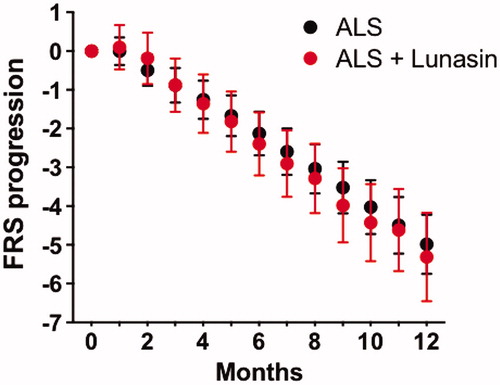
Figure 4 Participants’ perceived effectiveness. This figure shows the percentage of participants that rated perceived effectiveness in different categories. Most participants said they “couldn’t tell” or perceived no effectiveness from Lunasin.
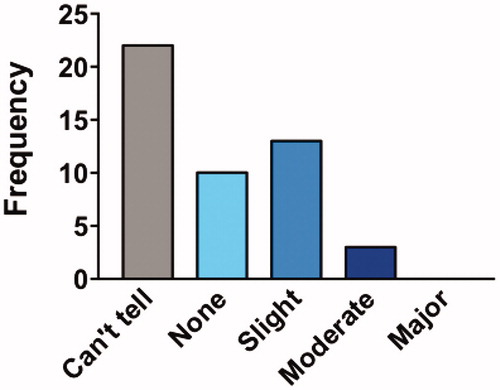
Figure 5 AcH3 and AcH4 levels in PBMCs. Representative immunoblot images of AcH3, AcH4, and H3 levels in healthy controls, ALS controls and ALS + Lunasin (a). There was no significant difference in AcH3 levels in PBMCs between groups (b). There was no significant difference in AcH4 in PBMCs between groups (c).
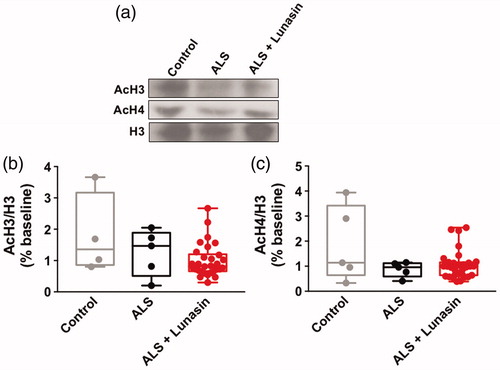
Figure 6 Participant ratings of side effects. Percentage of participants that rated their overall side effects in different categories. Most participants reported their side effects as “mild” or “none” but a few reported these as “severe”.
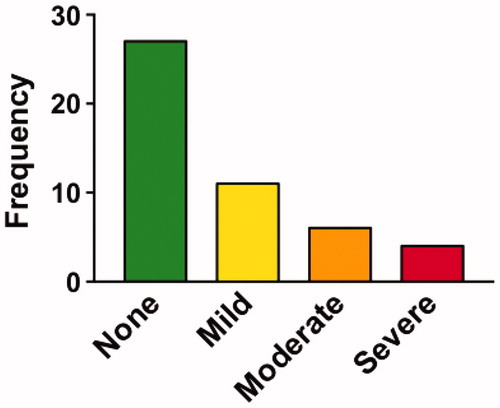
Table 2 Adverse events.
Figure 7 Adherence in participants versus those “playing along at home”. This figure shows that participant adherence (% completing at least 2 out of 3 PLM outcome measures) was high for the first 6 months of the study, then dropped off after that (solid line). On the other hand, a “play along at home” cohort (54 PLM users who started self-experimentation with Lunasin during our trial enrollment period) had much lower adherence (dashed line).
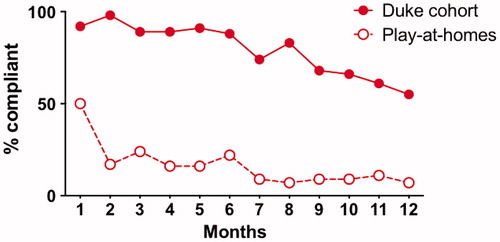
Table 3 Outcome measure agreement.