Figures & data
Figure 1 Schematic summarizing participant involvement during enrollment, participation, and data collection at follow-up. ALS: amyotrophic lateral sclerosis; , ALSFRS-R: ALS functional rating scores-revised; CNAQ: Council of Nutrition Appetite Questionnaire; BMI: body mass index; FM: fat mass; FFM: fat free mass; FVC: forced vital capacity as % of predicted; REE: resting energy expenditure.
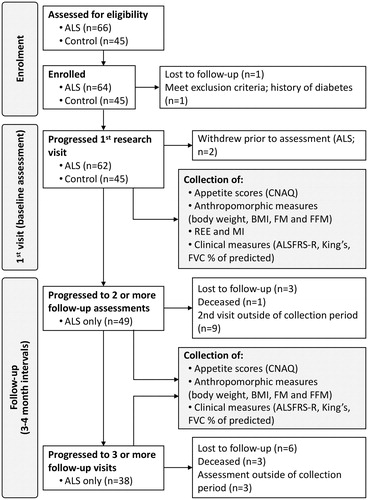
Table 1 Characteristics of patients with ALS (cases) and controls at the time of collection of baseline data.a
Figure 2 Council of Nutrition Appetite Questionnaire (CNAQ) scores in non-neurodegenerative disease subjects (Controls) and ALS patients (Cases). Twenty-nine percent of ALS patients presented with loss of appetite.
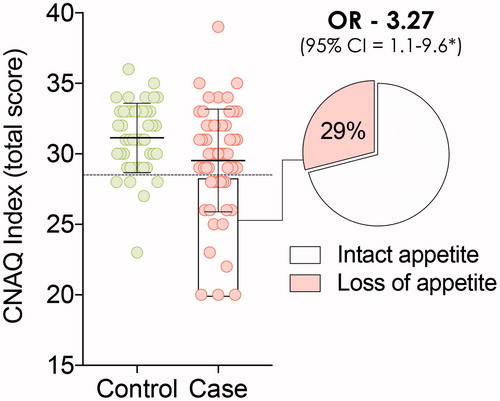
Table 2 Characteristics of patients with ALS with CNAQ scores suggesting intact (≥28) and loss (≤28) of appetite at the time of collection of baseline data.
Figure 3 (A) Illustration of the longitudinal pattern of two correlated outcomes: if measure 1 declines, measure 2 declines accordingly. For each patient we calculated the rate of decline in clinical outcomes using linear mixed effects models, i.e. the Best Linear Unbiased Predictions (BLUPs). (B) Correlation matrix in monthly rates of decline in Council of Nutrition Appetite Questionnaire (CNAQ) scores, clinical (ALSFRS-R and FVC), and anthropometric (body weight, BMI, fat mass, and fat free mass) measures. Data presented as Pearson’s r (p value); p values are adjusted according to the Holm-Bonferroni method. ALS: amyotrophic lateral sclerosis; ALSFRS-R: ALS functional rating scores-revised; BMI: body mass index.
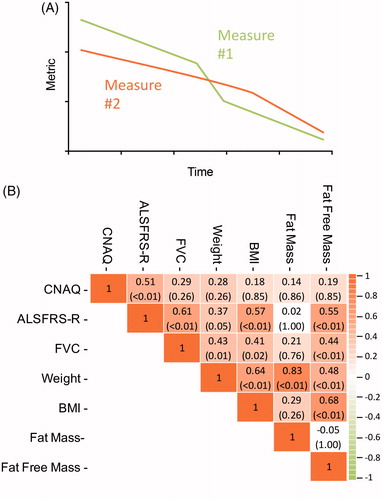
Table 3 Monthly rates of decline in clinical anthropometric measures from all ALS participants.a
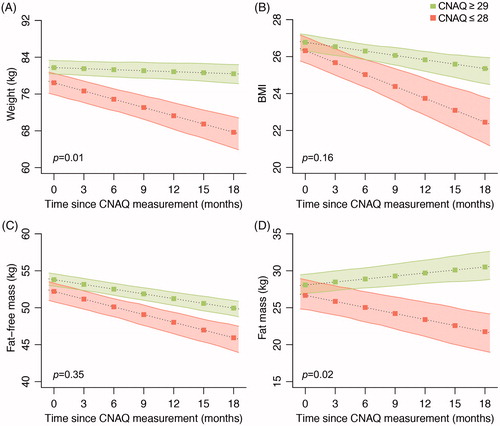
Figure 4 Change in (A) weight, (B) body mass index (BMI), (C) fat free mass, and (D) fat mass in ALS patients with intact appetite (CNAQ ≥29) and loss of appetite (CNAQ ≤28).