
Figures & data
Figure 1. TDP-43 fluorescence intensity, localization, and aggregation in ChAT+ cells in L3-L6 spinal cord segments. (A) Soma TDP-43 expression levels quantified by immunohistochemistry. Kruskal-Wallis test with Dunn’s post-hoc. (B) Cytoplasmic TDP-43 as a percentage of total soma expression. Kruskal-Wallis test with Dunn’s post-hoc. (C) Percentage of cells with cytoplasmic TDP-43 puncta. One-way ANOVA with Tukey’s post-hoc. (D) Number of cytoplasmic TDP-43 puncta per cell, normalized to cytoplasm area. Kruskal-Wallis test with Dunn’s post-hoc. (E) Representative immunohistochemistry images showing cytoplasmic TDP-43 puncta and predominantly nuclear TDP-43 expression in ChAT+ cells. Scale bar = 10 μm. Data is shown as mean ± SEM from 3 mice per genotype (N = 19 cells per mouse on average). *p < 0.05, **p < 0.01, ***p < 0.001, ****p < 0.0001, ns = not significant.
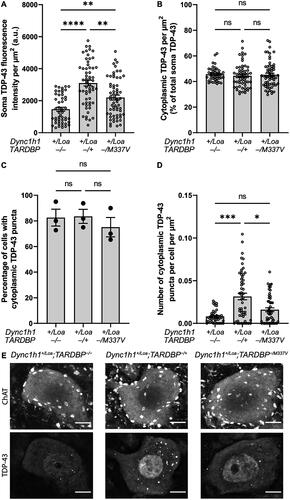
Figure 2. P62 puncta number and p62 intensity in ChAT+ cells in L3-L6 spinal cord segments. (A) Representative immunohistochemistry images showing examples of punctate (left column) and diffuse (right column) p62 expression in ChAT+ cells. Scale bar = 10 μm. (B) Percentage of cells with cytoplasmic p62 puncta. One-way ANOVA with Tukey’s post-hoc. (C) Number of cytoplasmic p62 puncta per cell, normalized to cell area. Kruskal-Wallis test with Dunn’s post-hoc. (D) Cytoplasmic p62 expression in ChAT+ cells. Welch’s ANOVA with Dunnett’s T3 post-hoc. Data is shown as mean ± SEM from 3 mice per genotype (N = 19 cells per mouse on average). ***p < 0.001, ****p < 0.0001, ns = not significant.
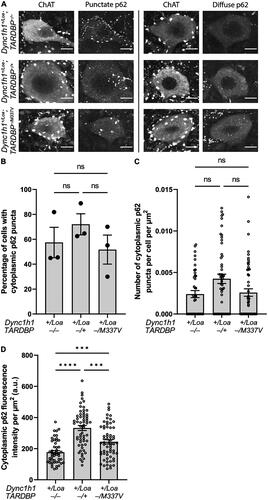
Figure 3. Colocalisation analysis of TDP-43 and p62 puncta in ChAT+ cells in L3-L6 spinal cord segments. (A) Representative immunohistochemistry (“staining”) and thresholded (“puncta only”) images showing the spatial relationship between TDP-43 (magenta) and p62 (cyan) puncta. Examples of TDP-43 puncta are indicated by yellow arrowheads, and examples of p62 puncta are indicated by white arrows. Scale bar = 10 μm. (B) Percentage of cells with coincident cytoplasmic p62 and TDP-43 puncta. One-way ANOVA with Tukey’s post-hoc. ns = not significant. Data is shown as mean ± SEM from 3 mice per genotype (N = 19 cells per mouse on average).
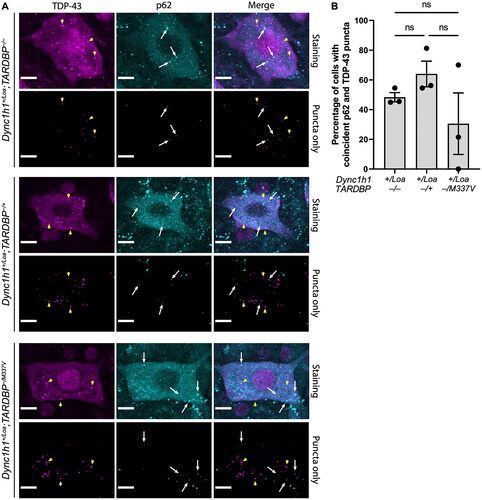
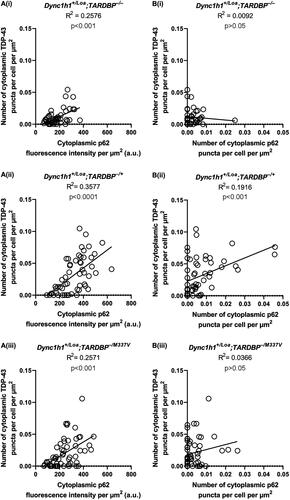
Figure 4. Correlation between TDP-43 and p62 puncta and expression levels in ChAT+ cells in L3-L6 spinal cord segments. (A) Correlations between p62 fluorescence intensity and TDP-43 puncta number. (B) Correlations between p62 puncta number and TDP-43 puncta number. Lines represent the simple linear regression fit and R2 values indicate the goodness of fit. Data is from 3 mice per genotype (N = 19 cells per mouse on average).
Data availability statement
The data that support the findings of this study are available from the corresponding author, MH, upon reasonable request.