
Figures & data
Table 1. Baseline demographics and clinical characteristics of enrolled patients.
Figure 1. Correlation between fat-free mass obtained by ADP versus BIA and GAL. Scatterplot of the FFM (in kg) values obtained from the (A) BIA and (B) GAL, both compared to ADP. BIA outcomes were used in Kyle’s equation (Citation30). BIA: bioelectrical impedance analysis; ADP: air-displacement plethysmography; r: Pearson’s r correlation coefficient; FFM: fat-free mass; GAL: Gallagher formula.
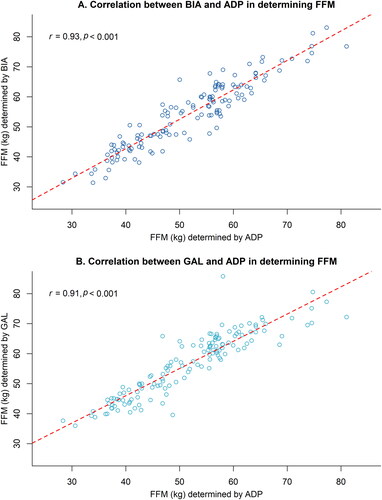
Figure 2. Differences in FFM when determined by BIA, GAL, and ADP. Bland–Altman plots visualizing the differences in FFM (in kg) of the BIA (panel A) and GAL (panel B) compared to ADP in MND patients (n = 140). Blue area indicates the 95% confidence intervals around the mean difference. Dotted lines indicate the 95% limits of agreement. BIA outcomes were used in Kyle’s equation (Citation30). BIA: bioelectrical impedance analysis; ADP: air-displacement plethysmography; ICC: intraclass correlation coefficient; CI: confidence interval; SEM: standard error of measurement; FFM: fat-free mass; GAL: Gallagher formula.
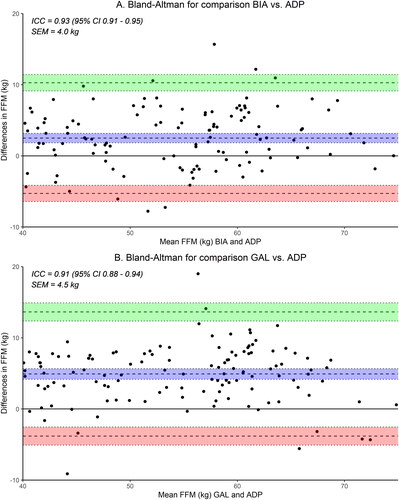
Table 2. Overview of the measured FFM and FM (kg and %) and the difference between the BIA, GAL and ADP in patients with MND (n = 140).
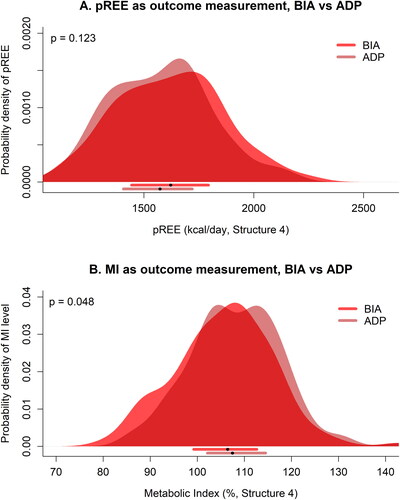
Figure 3. Differences in calculating predicted REE and MI using data provided by BIA and ADP. Figure shows probability densities of (A) the predicted REE based on data provided by BIA versus ADP, and (B) having a certain metabolic index based on data provided by BIA versus ADP, in patients with MND. BIA outcomes were used in Kyle’s equation (Citation30). The horizontal bars below every panel provide the median (black dots) with their 25–75% interquartile range. pREE: predicted resting energy expenditure; BIA: bioelectrical impedance; ADP: air-displacement plethysmography; MI: metabolic index. P-values are Wilcoxon signed-rank test.
Supplemental Material
Download Zip (228.2 KB)Data availability statement
All protocol, analyses, and anonymized data will be shared on request from any qualified investigator. We take full responsibility for the data, the analyses and interpretation, and the conduct of the research.