
Figures & data
Table 1. Reference values for 30 s chair stand test [Citation35,Citation36].
Table 2. Patient characteristics (n = 114).
Figure 1. Flow chart of participants and analysis for intra- and inter-rater reliability of 30-second chair stand test (30CST).
Rectangular boxes connected to one another. Step one starts from the top with describing recruitment and step 2 the number of patients included in the analysis. Step 3 the assessment and the results of self-test 1, and then self-test 2 (step 4), and at last physiotherapist assessment (step 5). Step 3 and 4, respectively step 4 and 5, are connected to separate boxes to the right, showing results of the reliability analysis. A big arrow in the upper right of the image include description of excluded patients, and a white box in the lower right contains explanations of abbreviations used in the figure.
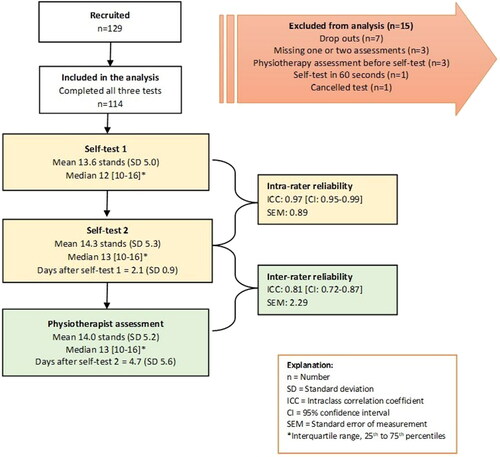
Figure 2. (a,b) Receiver operating characteristic (ROC)-curve analysis of 30-second chair stand test (30CST) to classify reduced physical function. (A) self-test 1, (B) self-test 2. Reduced physical function was categorised through normative values [Citation35,Citation36].
Two graphs with sensitivity on the y-axis (0 to 1) and 1-specifity on the x-axis (0 to 1). The curves start from lower left corner and ends in the upper right corner.
![Figure 2. (a,b) Receiver operating characteristic (ROC)-curve analysis of 30-second chair stand test (30CST) to classify reduced physical function. (A) self-test 1, (B) self-test 2. Reduced physical function was categorised through normative values [Citation35,Citation36].](/cms/asset/5f39014e-8556-4e7f-a4a8-0cd544e1372c/iejp_a_2337419_f0002_b.jpg)
Supplemental material
Supplemental Material
Download Zip (48.3 KB)Data availability statement
Decoded data are available on reasonable request.