Figures & data
Table 1. List of primers and FASTA accession numbers of the genes analyzed by real time qPCR analysis. All primers were designed in house using NIH’s Primer Blast and acquired from Integrated DNA Technologies (USA).
Figure 1. Behavior profile of Ztm mice compared to WT mice. Marble Burying (a, b): Total number of marbles buried is significantly higher in Ztm females than wt females (b), no differences seen in males (a). Open field (C, D, E, F): Time spent in the center of the field is significatively higher in Ztm males than wt males (c). No significant difference was seen on females (d). Distance traveled was similar for both males (e) and females (f). Track images are representative of each group. Elevated Zero Maze (g, h): Ztm mice spent significant less time in the open arm than WT mice (g), no difference seen in the female group (h). N = 13–17.
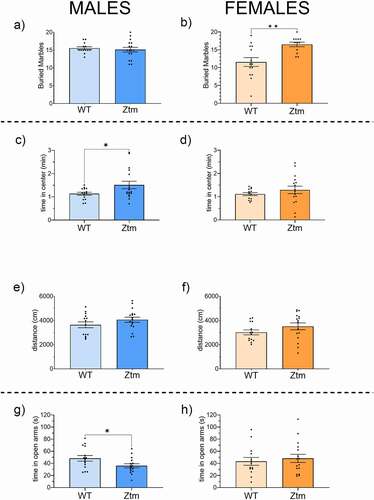
Table 2. List of genes analyzed by real time PCR in the brain of adult mice (n = 4–10). Expressed as Fold Change (FC), statistics calculated with the non- parametric Mann-Whitney test (p).
Figure 2. Gene expression profile for BBB TJs and neuroinflammation markers. mRNA expression was analyzed by qPCR normalized to WT and expressed as fold change ± SEM. (a) Increased OCCLN and veCad in Ztm males compared to WT males in the BBB. (b) Altered neuroinflammatory profile in the Ztm male brain. (c) Significant downregulation of BBB TJs in the Ztm female brain. (d) No change in the neuroinflammatory profile of the Ztm females.
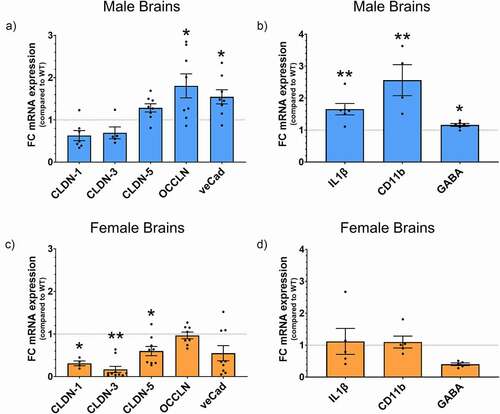
Figure 3. Gut microbiota dysbiosis in males and females Ztm mice. Stools from WT (males n = 7, females n = 9) and Ztm mice (males n = 6, females n = 10) were analyzed. (a, b): Principal Component Analysis (PCA) of Jaccard distances for Ztm and WT mice show clustering between Ztm and WT males (a) and females (b). The closer the spatial distance of the sample, the more similar the species composition of the sample. (c, d): Shannon Index expression of alpha diversity (variation/complexity of the microbiome within the group). WT males show a less diverse microbiota than Ztm males (c). Similar alpha diversity observed int the Ztm and WT females (d).
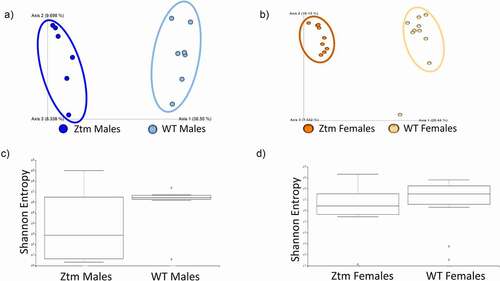
Figure 4. Histogram of the community composition of gut microbiota at the class level. The abscissa represents the group, and the ordinate represents the relative abundance. The figures show species with a relative abundance of 1% or more. (a): Lower abundance of Alphaproteobacteria and Verrucomicrobiae in Ztm males when compared to WT males. (b): Ztm females show lower abundance of Proteobacteria, Verrucomicrobiae and Cyanobacteriia in their stools.
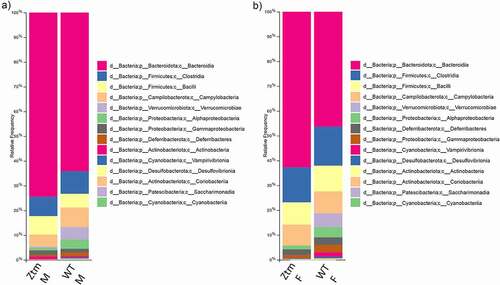
Figure 5. ANCOM volcano plot of statistical differences between Ztm and WT at genus level. (a): Ztm males harbor a significant increased abundance of Rikenella sp. vs. an abundance of A. muciniphila in WT males. (b): Ztm females show an abundance of Rikenella sp. and a reduction of A. muciniphila when compared to WT females.
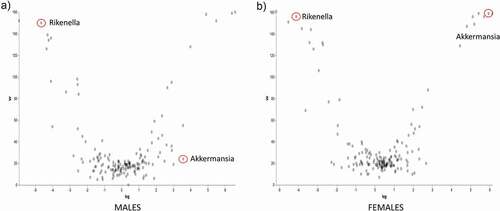
Figure 6. Effect of Abx treatment on gut microbiota composition in Abx-treated Ztm and WT mice. Stools from 21 WT mice (males n = 13, females n = 8) and 16 Ztm (males n = 8, females n = 8) were analyzed. (a, b): In Principal Component Analysis (PCA) of Jaccard distances for Abx -treated Ztm (ZtmAbx) and Abx-treated WT (WTAbx) mice revealed no distinct microbiota clustering between Abx-treated Ztm and WT males (a) or females (b). (c, d): Shannon Index, expression of alpha diversity (variation/complexity of the microbiome within the group). Alpha diversity was reduced in Abx-treated Ztm males when compared to Abx-treated WT males (c), and in Abx-treated Ztm females when compared to Abx-treated WT females.
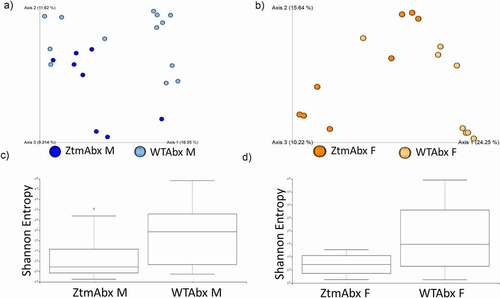
Figure 7. Histogram of the community composition of gut microbiota at the class level after Abx treatment. Abx-treated Ztm (ZtmAbx) males have a higher abundance of Firmicutes (Bacilli), and severely decreased Alphaproteobacteria and Cyanobacteriia composition compared to Abx-treated WT (WTAbx) mice. (b): Abx-treated Ztm females show a dramatic increase in Gammaproteobacteria and a drastic reduction of Alphaproteopacteria and Cyanobateriia when compared to WTAbx females.
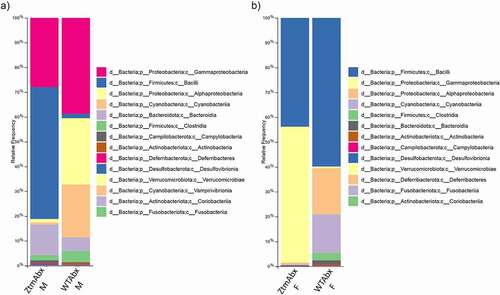
Figure 8. ANCOM volcano plot of statistical differences between Abx-treated Ztm and Abx-treated WT mice at genus level. (a): Abx-treated Ztm (ZtmAbx) males harbor a significantly higher abundance of Ureaplasma sp. compared to Abx-treated WT (WTAbx) males. (b): Abx-treated WT (WTABX) females show significantly more abundant Erwiniaceae sp. when compared to Abx-treated Ztm (ZtmAbx) females.
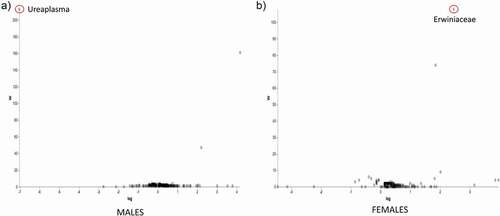
Table 3. List of genes analyzed by real time PCR in the brain of Abx-treated Ztm mice (n = 8 per group), normalized to Abx-treated WT mice. Expressed as Fold Change (FC), statistics calculated with the non- parametric Mann-Whitney test (p).
Figure 9. Effect of Abx gut microbiota depletion on the gene expression profile of TJs in the duodenum of Abx-treated mice. mRNA expression was analyzed in ZtmAbx treated mice by qPCR, normalized to WTAbx, and expressed as fold change ± SEM. (a): No differences were seen in the Abx-treated Ztm male mice when compared to Abx-treated WT males. (b): Abx-treated Ztm females show a significantly decreased CLDN-4 mRNA expression when compared with Abx-treated WT females.
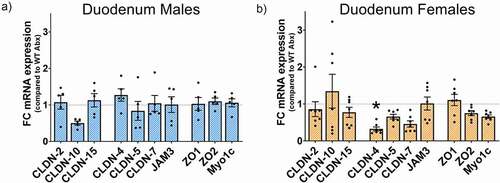
Figure 10. Effect of Abx gut microbiota depletion on Zonulin mRNA expression in the brain prefrontal cortex and the duodenum of Abx-treated Ztm mice. mRNA expression was analyzed by qPCR in Abx-treated Ztm mice, normalized to Ztm mice (non Abx-treated), and expressed as fold change ± SEM. Microbiota depletion significantly decreased mRNA zonulin expression in the brain and duodenum of (a): males and (b): female Abx-treated Ztm mice when compared to Ztm.
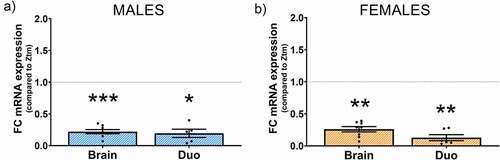
Figure 11. Effect of Abx gut microbiota depletion on the gene expression profile for BBB TJs and neuroinflammation markers on Abx-treated Ztm. mRNA expression was analyzed in Abx-treated Ztm (ZtmAbx) mice by qPCR, normalized to Abx-treated WT (WTAbx) mice, and expressed as fold change ± SEM. (a): Abx-treated Ztm males show an increased mRNA expression of CLND-1, CLDN-3, and CLDN-5 in the BBB, whereas veCad is significantly decreased when compared to Abx-treated WT males. (b): Altered neuroinflammatory profile in the Abx-treated Ztm male brain prefrontal cortex, showing a significant decrease in CD11b and GABA. (c): mRNA expression in Abx-treated Ztm females shows a generalized increase, except for veCad that is significantly decreased when compared to Abx-treated WT females. (d): CD11b and GABA are decreased in Abx-treated Ztm females when normalized against Abx-treated WT females.
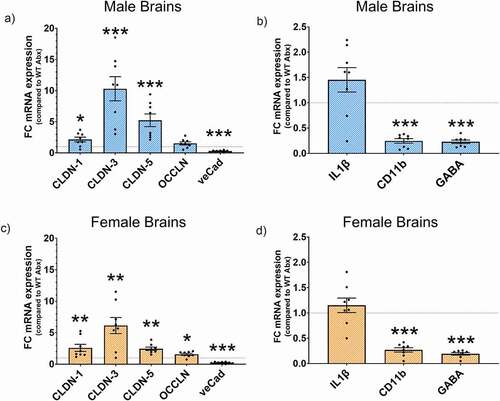
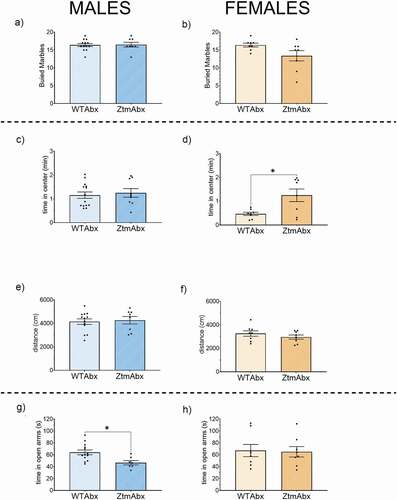
Figure 12. Effect of Abx gut microbiota depletion on the behavior profile in Abx-treated Ztm (ZtmAbx) mice compared to Abx-treated WT (WTAbx) mice. Marble Burying (a, b): No differences in the number of marbles buried were observed in Abx-treated males (a) and Abx treated females (b). Open field (C, D, E, F): No significative difference in the time spent in the center of the filed was observed in Abx-treated Ztm males compared to Abx-treated WT mice (c). Abx treated Ztm females spend significantly more time in the center of the field than Abx-treated WT females (d). Distance traveled was similar for both males (e) and females (f). Track images are representative of each group. Elevated Zero Maze (g, h): Abx-treated Ztm male mice spend significatively less time in the open arm than Abx-treated WT mice (g). No differences were detected in the female group (h). N = 8–13.