Figures & data
Figure 1. SEM images and size distribution of Bio-CS-PLGA NPs (a: Bio-CS-PLGA NPs, b: degraded for 4 week; c: degraded for 8 weeks).
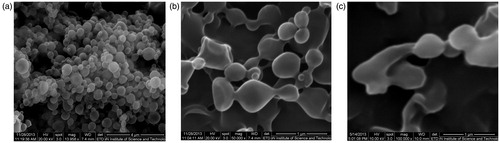
Figure 2. AFM image of Bio-CS-PLGA NPs deposited on silicon dioxide at 300 K.
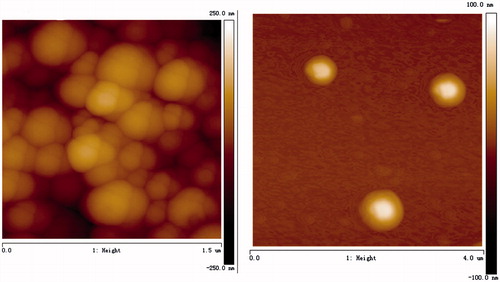
Figure 3. Cumulative release profiles of EPB from Bio-CS-PLGA NPs.
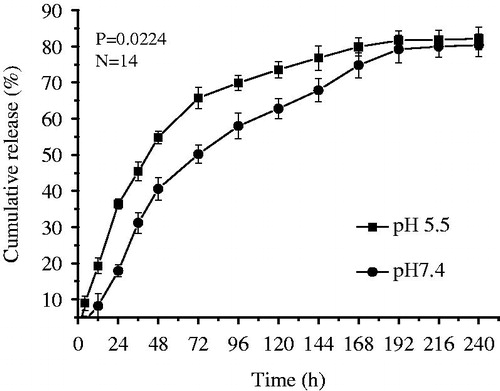
Figure 4. The changes of the size and the zeta potential of the NPs against the storage time.
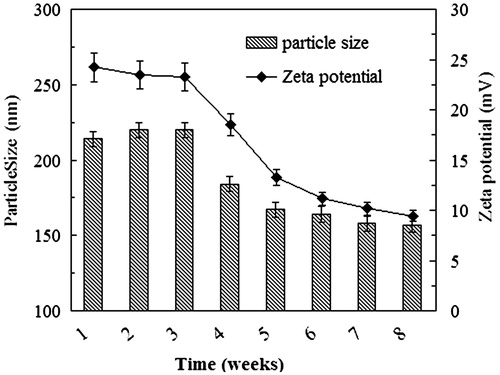
Figure 5. Representative photomicrographs of the heart, liver, spleen, lung, and kidney sections (H&E staining) of mice of control group (a) and treated with test Bio-CS-PLGA NPs (b).
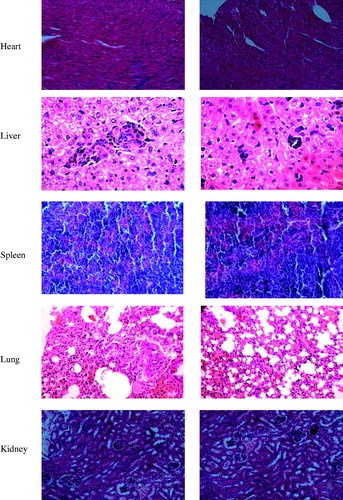
Table 1. Body weight of Bio-CS-PLGA NPs i.v. injected in mice at 300 mg/kg dose (xo ± s, g).
Table 2. Food intake of Bio-CS-PLGA NPs i.v. injected in mice at 300 mg/kg dose (x(± s), g).
Table 3. Hematological indexes and biochemical indexes.
Figure 6. Plasma drug concentration of EPB and Bio-CS-PLGA NPs after i.v. injection.
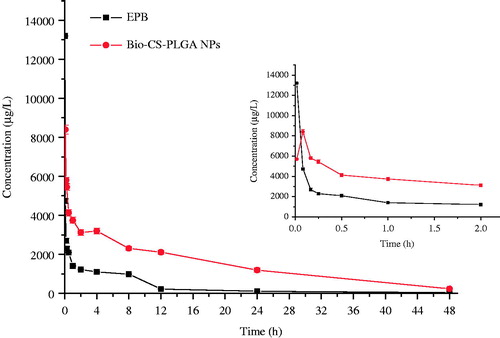
Table 4. Pharmacokinetic parameters of EPB and EPB loaded Bio-CS-PLGA NPs i.v. injected in rats at the equivalent 10 mg/kg dose.
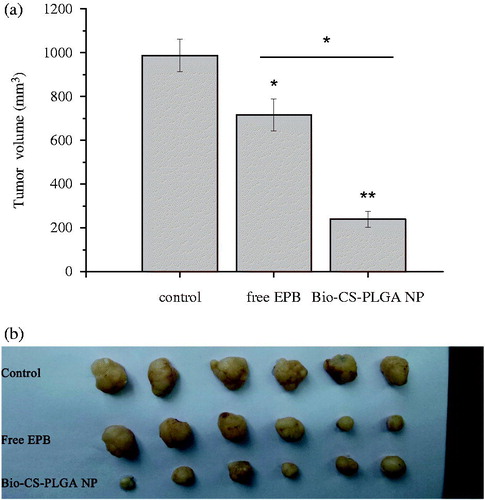
Figure 7. The inhibition effects of EPB-loaded NPs on the in vivo tumor growth. (a: the volume of tumors in nude mice bearing MCF-7 tumors after intravenous injections of free EPB and EPB-loaded NPs; b: the picture of tumors removed from tumor-bearing nude mice at 21 days after the first injections. * and ** represent P < 0.05 and P < 0.01, respectively).