Figures & data
Figure 1. SEM images of (І) ATV/PVP, (ІІ) EZT/PVP and (ІІІ) ATV/EZT:PVP nano-solid dispersions, (A) and (B) ESs with the drug to polymer ratio of 1:1 and solution concentrations of 10% and 20% (w/v), respectively, (C) and (D) ESs with the drug to polymer ratio of 1:5 and solution concentrations of 10% and 20% (w/v), respectively.
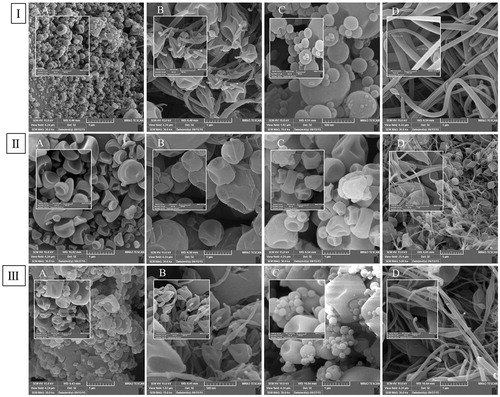
Figure 2. DSC thermograms of the PVP K30, pure drugs, corresponding physical mixtures (PMs), and electrosprayed samples (ESs) all in 1:1 ratio.
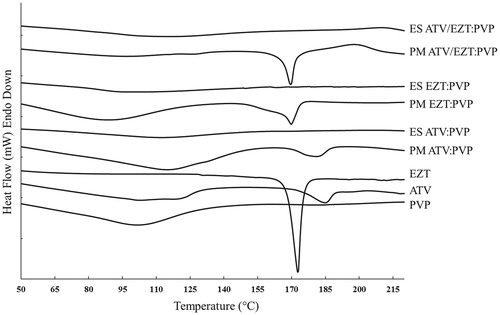
Figure 3. PXRD patterns of the PVP K30, pure drugs, corresponding physical mixtures (PMs), and electrosprayed samples (ESs) all in 1:1 ratio.
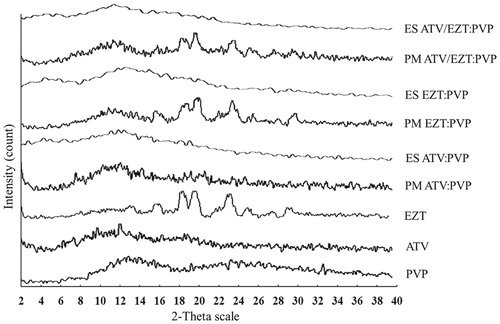
Figure 4. FTIR spectra of the PVP K30, pure drugs, corresponding physical mixtures (PMs), and electrosprayed samples (ESs) all in 1:1 ratio.
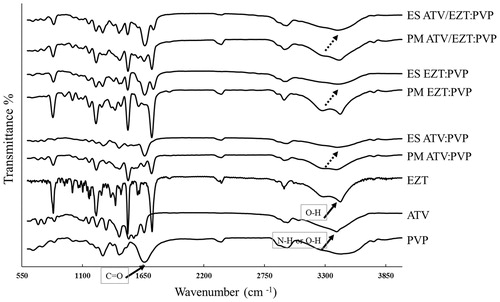
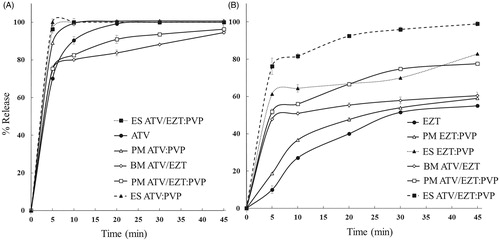
Figure 5. Drug release profile of various formulations. Left panel (A) ATV release from ATV/EZT binary mixture (BM—○—), pure drug (—•—), physical mixtures (PM—▵— —□—), and electrosprayed samples (ES—▴— —▪—) all in 1:1 ratio. Right panel (B) EZT release from BM, pure drug, PMs, and ESs as mentioned above. Each point represents mean ± SD (n = 3).