Figures & data
Figure 1. 1H NMR spectrum of PEG–PLGA co-polymer.
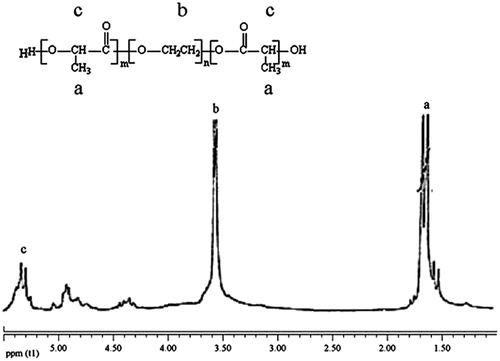
Figure 2. Nanoencapsulated chrysin in scanning electron microscopy micrograph. SEM shows the particle size range between 40 and 75 nm.
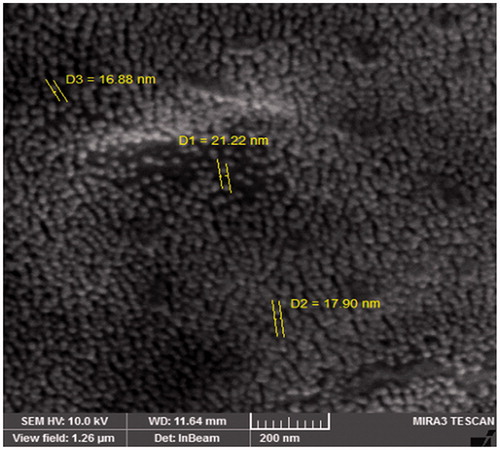
Figure 3. FT-IR plots of pure chrysin (A) and chrysin loaded PLGA–PEG (B). The bands at 2840–3000 cm−1 indicate C–H stretch of CH. The bands at 1090–1300 cm−1 indicate interaction between C–C and C–O. The bands at 1085–1150 cm−1 are assigned to ether of PEG.
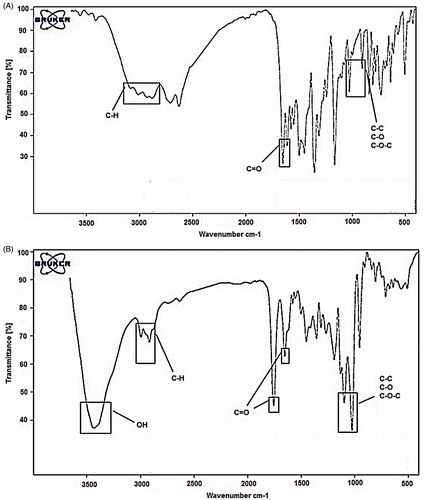
Figure 4. Comparison of cytotoxic effects for different concentrations of pure and nanoencapsulated chrysin for 24, 48, and 72 h. A, B, and C related to treatment for 24, 48, and 72 h, respectively. Results expressed as the mean ± SD (n = 3) (*P < 0.05, **P < 0.01).
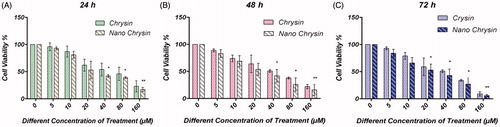
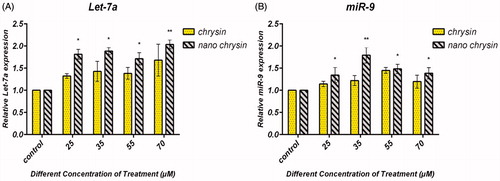
Figure 5. Chrysin and PLGA–PEG–chrysin induced expression of Let-7a and miR-9 in gastric cancer cell line. AGS cells were exposed to 25, 35, 55 and 70 μM for 24 h, and the expression of Let-7a and miR-9 was assessed by qRT-PCR. Triplicate assays were performed for each RNA sample and the relative miRNA was normalized to miR-16. (A) Let-7a and (B) miR-9, nanoencapsulated chrysin showed a two-fold increase in expression for Let-7 and miR-9 at concentration levels of 70 μM and 35 μM, respectively (P = 0.01). Data are presented as mean ± SD from three independent experiments (*P < 0.05, **P < 0.01). The P values under 0.05 were set as significance.