Figures & data
Figure 1. L. camara Linn root extract treated with HAuCl4 resulted Au NPs (dark purple).
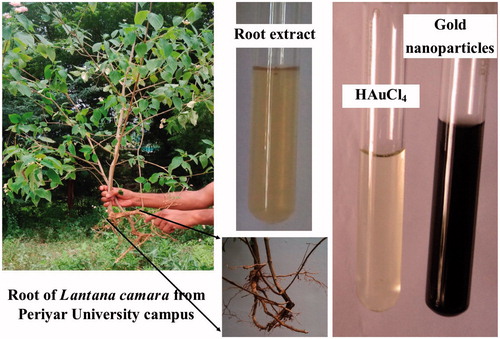
Figure 2. UV-visible spectra of Au NPs synthesized by L. camara root extract.
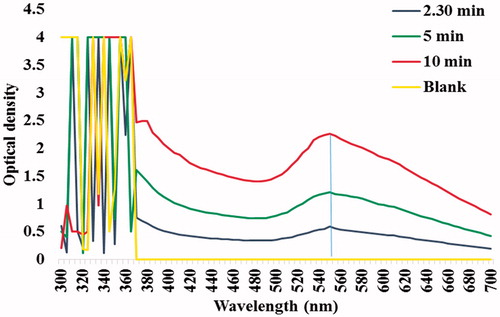
Figure 3. X-ray diffraction patterns of synthesized Au NPs.
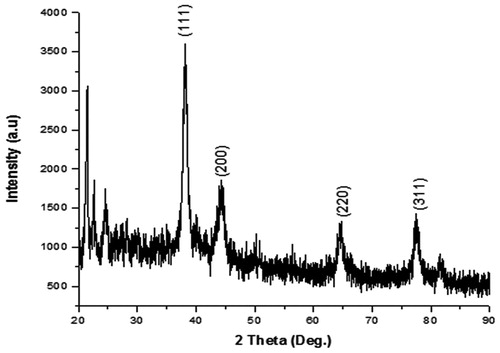
Figure 4. FT-IR spectrum of synthesized Au NPs of L. camara root.
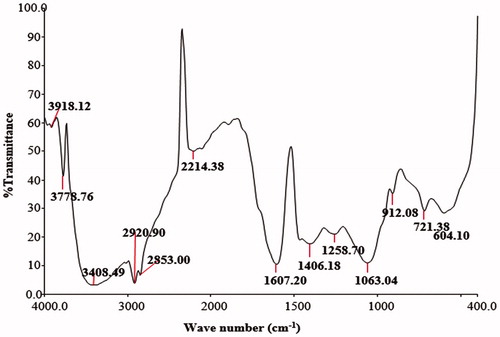
Figure 5. HR-TEM of Au NPs synthesized from root extract of L. camara. (a) and (b) the shapes and different sizes of Au NPs; (c) EDX analysis of Au NPs of L. camara; (d) SAED pattern showing that the nanoparticles are crystalline.
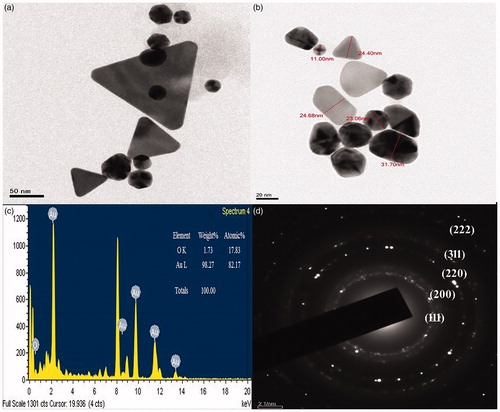
Figure 6. The DPPH scavenging assay of root extract, Au NPs, and Gallic acid.
DPPH scavenging ability of Au NPs vs. root extract and ascorbic acid. Values are mean of independent determinations. Two-way ANOVA, significant different from Au NPs: “*” p < 0.001.
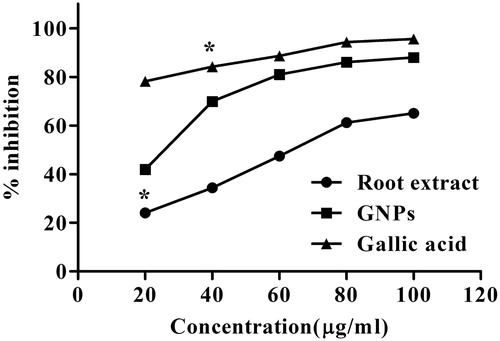
Figure 7. Percentage growth curve of MDA-MB-231 against the Au NPs.
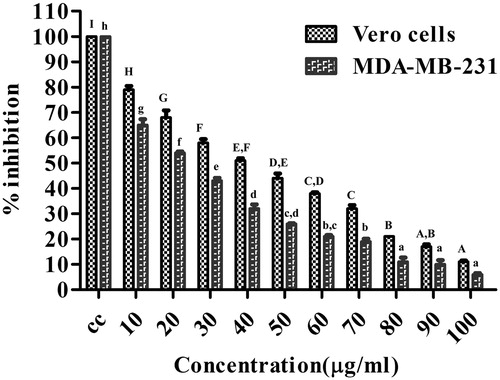
Figure 8. Cytotoxicity (a) Untreated, (b) treated MDA-MB-231 cells at 48 h, (c) Live cells (AO-Et-Br staining), and (d) damaged cells.
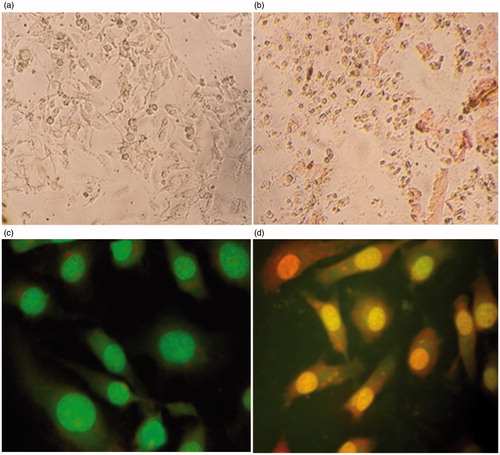
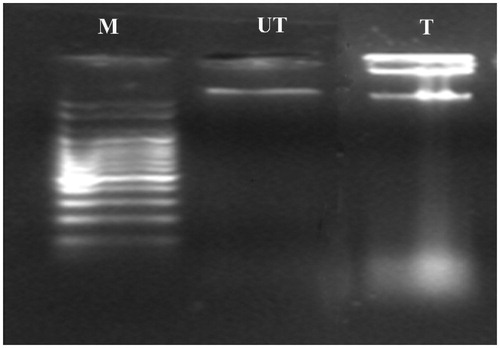
Figure 9. DNA fragmentation assay.
Where, M, Marker; UT, untreated cells at 48 h; T- MDA-MB-231 cells exposed with GNPs.