Figures & data
Figure 1. pH, Lactate, HCO3− and base excess (BE) values in rat hemorrhagic shock model. Blood samples were drawn before the start of hemorrhage (baseline), end of shock, end of resuscitation, 1 h after resuscitation and 3 h after resuscitation to assess anaerobic metabolism. Blood gas analysis was performed on a GEM premier 3000 (Instrumentation Laboratory, USA) *P < 0.05 in comparison with the end of shock; #P < 0.05 in comparison with the pPolyHb group; $P < 0.05 in comparison with the RBC group. (A) pH values at different periods in rats resuscitated with pPolyHb, RBC, or HES. (B) Lactate levels at different periods in rats resuscitated with pPolyHb, RBC, or HES. (C) HCO3− levels at different periods in rats resuscitated with pPolyHb, RBC, or HES. (D) BE levels at different periods in rats resuscitated with pPolyHb, RBC, or HES.
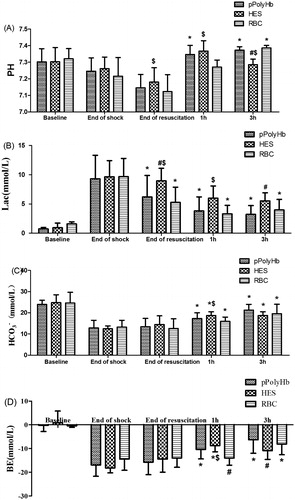
Figure 2. Blood pressure and heart rate in rat hemorrhagic shock model. (A) Mean arterial blood pressure (MAP) and (B) heart rate (HR) were monitored every 10 min throughout the experiment. +P < 0.05 in comparison with baseline; #P < 0.05 in comparison with the pPolyHb group; $P < 0.05 in comparison with the RBC group.
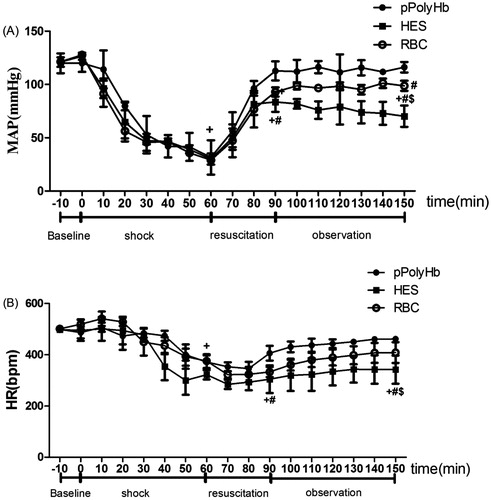
Figure 3. Microscopic observations of mesenteric microvascular from hemorrhagic shock model of rats. Microvascular digital images were recorded at baseline, the end of the shock, the end of resuscitation, 30 min and 60 min after resuscitation. The left column shows representative vessels from the pPolyHb group, the middle column from the HES group, and the right column from the RBC group. A: venule B: arteriole.
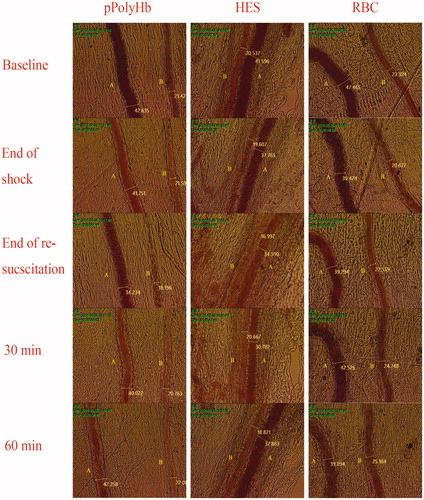
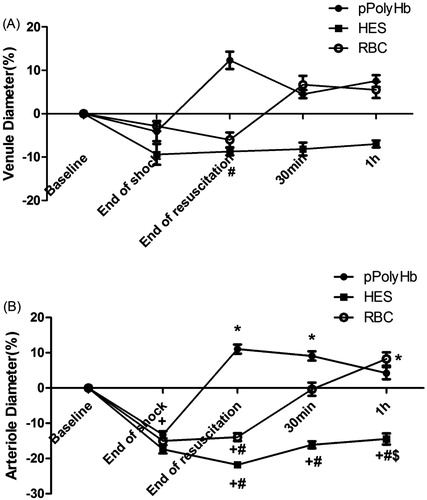
Figure 4. Venule and arteriole diameters in rat hemorrhagic shock model. (A) Venule diameters and (B) arteriole diameters were monitored at different periods in rats resuscitated with pPolyHb, RBC, or HES. +P < 0.05 in comparison with baseline; *P < 0.05 in comparison with the end of shock; #P < 0.05 in comparison with the pPolyHb group; $P < 0.05 in comparison with the RBC group.