Figures & data
Figure 1. (a) ZnO (a) and (b) ZnO (c) induced growth inhibition in breast cancer cell line MCF-7. Growth inhibition was assessed using MTT assay. Each value is presented as mean ± SD of three experiments. *P < 0.05; **P < 0.01 compared with the untreated control group.
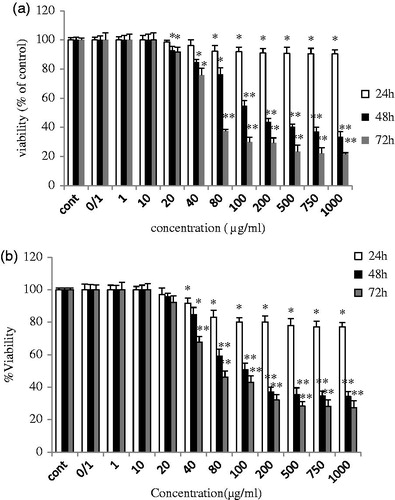
Figure 2. Diagram of (d) shows induced growth inhibition in breast cancer normal human fibroblast cell, MRC-5. ZnO (a) and ZnO (c) inhibited the growth of normal human fibroblast cell line MRC-5, after 72 h of treatment, in a dose-dependent manner with the IC50 values of 194 and 352 μg/ml, respectively. The data revealed that ZnO (a) and ZnO (c) displayed significantly higher cytotoxic effects on cancer cells than on normal cells.
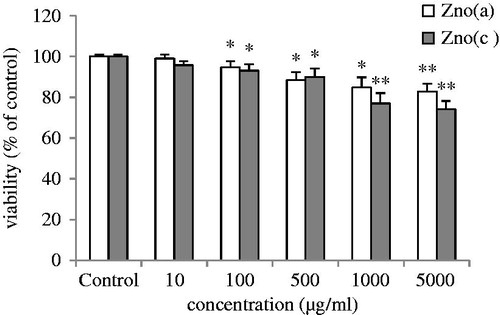
Figure 3. Cytotoxicity effect of ZnO (a) and ZnO(c) induced growth inhibition in breast cancer cells MCF-7 and normal human fibroblast cells MRC-5. Growth inhibition was assessed using MTT assay. Each value is presented as mean ± SD of three experiments.
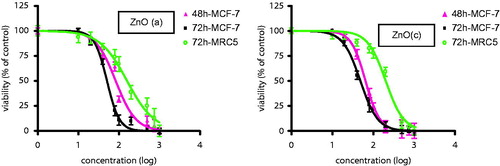
Table 1. IC50 measurement and absorbance of breast MCF7 cancer cell lines after 48 and 72 h.
Figure 4. Detection of typical features for apoptosis nuclear condensation by Hoechst 33258 staining. MCF-7control (untreated) and treated with 100 μg/ml of ZnO (a) and ZnO (c) were stained with Hoechst 33258.
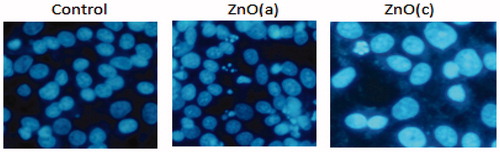
Figure 5. Microscope fluorescence images of (a) original cell lines MCF-7 before any treatment by nanoproducts, and (b) after treatment with influence of ZnO (a) and ZnO (c) nanodrugs caused significant morphological changes which are signs of cell death (the kind of deformation and agglomeration of MCF-7 cancer cell models).
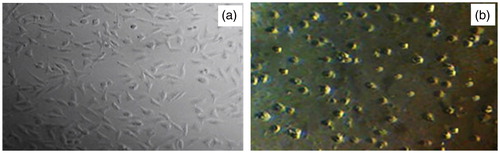
Figure 6. Presentation of various kinds of SEM pictures of ZnO (c) nanoformulation containing (a) fine nanospherical-shaped, nanorod–nanotubes mixture, and rare beautiful snail-shaped images with functionalized surface, (b) the luminance nanoparticles through the extended nanorods in ZnO (a) nanocomposites along with homogeneous pattern.
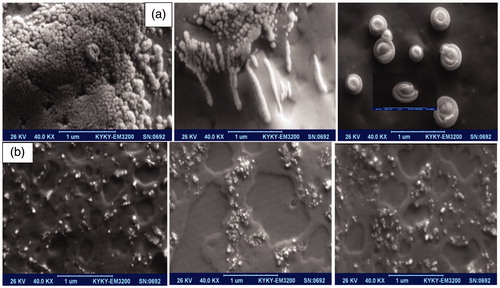
Figure 7. FTIR important spectroscopy of two nano products of ZnO (c) (black curve) and ZnO (a) with red line. It could characterized all the vacancy defect.
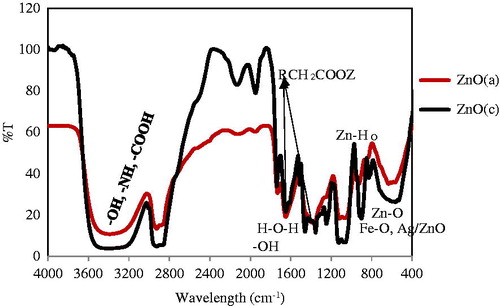
Figure 8. UV-Vis absorption spectra of two nanoproducts, ZnO(c) with black line and ZnO (a) with red one in blue shifts experimental conditions. ZnO (c) shows higher intensity compared to ZnO (a) in UV-Vis curve
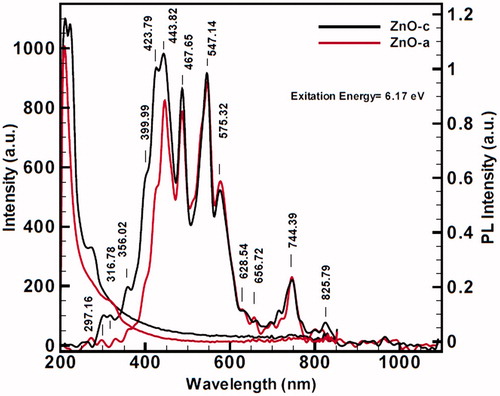
Figure 9. Schematic overview of relevant photoluminescence diagram, optical adsorption, and ZnO NPs’ characteristics and their effects on nanotoxicological properties including wide band gap with more trapping states containing high excitation energies.
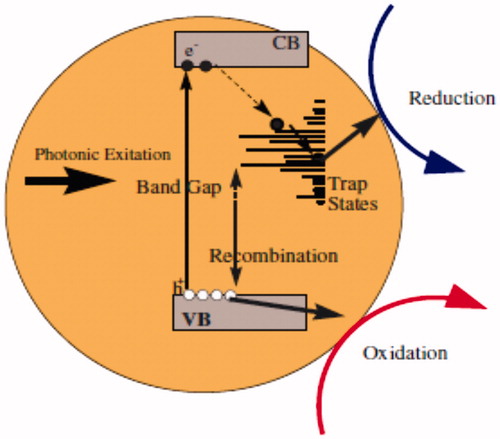
Figure 10. Photoluminescence (PL) spectrum of red color ZnO (a) and black color ZnO (c) in 200–1000 nm, including many blue and red shifts with high excitation energies, (a) contains 6.17 excitation energy (λ = 201 nm), and photoluminescence expansion spectra for (b) contains 4.13 eV excitation energy. PL spectra also indicate broad saturations for strong surface functionalization for two nanoproducts. In (a), ZnO(c) begins with more velocity than ZnO (a), and in diagram of (b), the intensity of ZnO (a) at 451.64 nm comes above the ZnO (c).
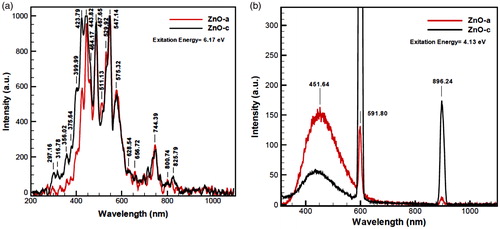
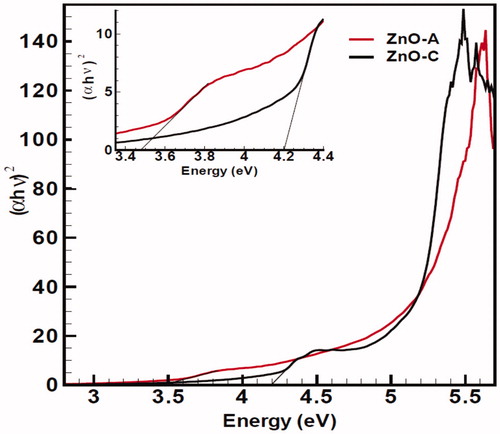
Figure 11. The bandgap energy transition for two nanofluids, (a) black line ZnO (c), and (b) red line ZnO (a). Inset of two transitions has been shown in the up of Figure. The presence of a high-intensity of ZnO(c) is observed.