
Figures & data
Scheme 1. Preparation of CS-MCM-41 nanocarrier.
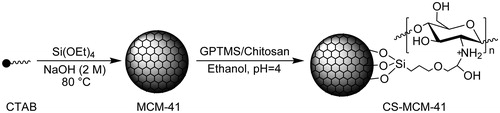
Figure 1. Electron microscopy of MSNs. (a) FESEM image of uniform nanospheres and inset: the particle size distribution histograms (b) TEM image of hexagonal array of channels.
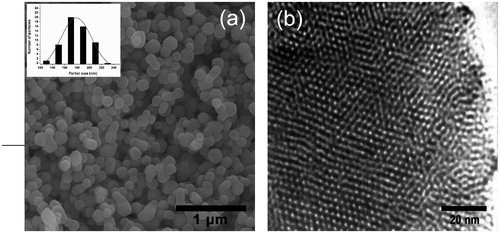
Figure 2. (a) XRD pattern and (b) nitrogen adsorption–desorption isotherms of the fabricated MCM-41.
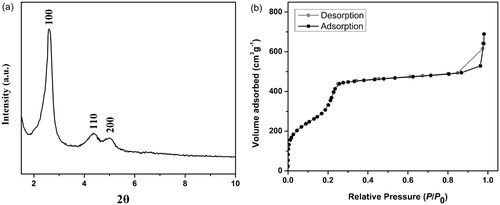
Figure 3. FT-IR spectra of KBr pellets of the MCM-41, CS-MCM-41, Cur@CS-MCM-41 nanocarrier and free curcumin.
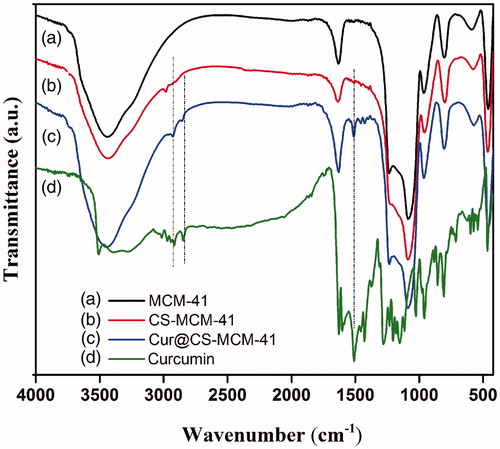
Figure 4. Encapsulation efficiency and loading efficiency of curcumin in CS-MCM-41 nanocarrier. Data were expressed as mean ± SDs (n = 3) and inset (a) blank CS-MCM-41, (b) Cur@CS-MCM-41 and (c) free curcumin in PBS buffer.
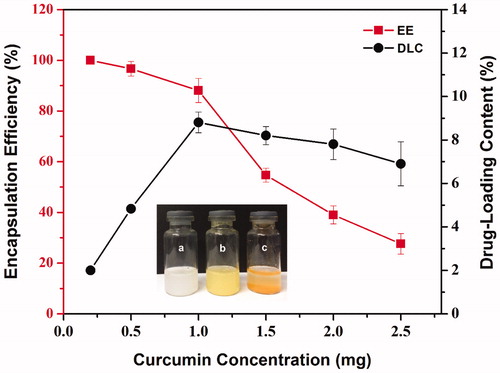
Figure 5. (a) In vitro release profiles of curcumin from Cur@CS-MCM-41 and Cur@MCM-41 in 0.1 mol/l PBS buffer under different pH values (each data represents as average (n = 3)±SD). (b) The overall scheme of Cur@CS-MCM-41 in different pH.
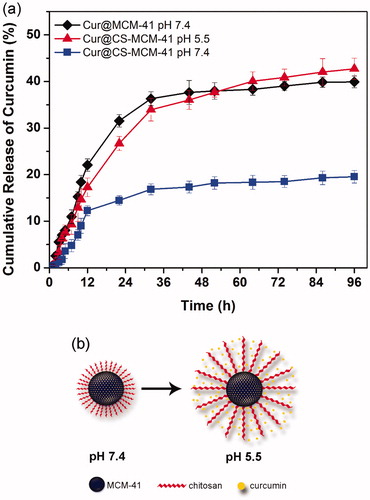
Figure 6. Cytotoxicity of free curcumin, Cur@CS-MCM-41 and Cur@MCM-41 against U87MG and evaluated at (a) 24 h and (b) 72 h after the treatment. Data are shown as the mean ± SD (n = 3), as a percentage relative to the control.
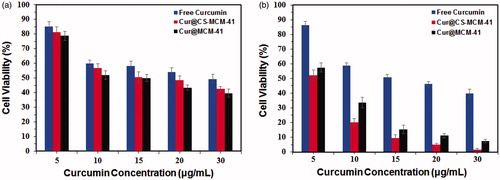
Table 1. The IC50 values of free curcumin, Cur@CS-MCM-41 and Cur@MCM-41 toward U87MG cells as measured with MTT assay at different times of incubation.