Figures & data
Table 1. Size, PDI and zeta potential of PA-NLC, R-NLC and PAR-NLC.
Figure 1. Cellular uptake of PA-NLC, R-NLC and PAR-NLC in different cell lines at different incubation time. (A) EGFR-positive cell NCI-H1299, left for 1 h and right for 4 h; (B) EGFR-positive cell S180, left for 1 h and right for 4 h; (C) EGFR-negative cell K562, left for 1 h and right for 4 h.
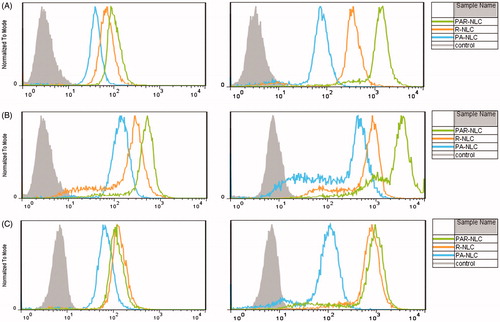
Figure 2. Confocal laser scanning microscopy (CLSM) images of NCI-H1299 cells incubated with PA-NLC, R-NLC and PAR-NLC at different incubation time. (A) 1 h and (B) 4 h. Green signal is Cou6, blue signal is the cell nuclei stained by DAPI.
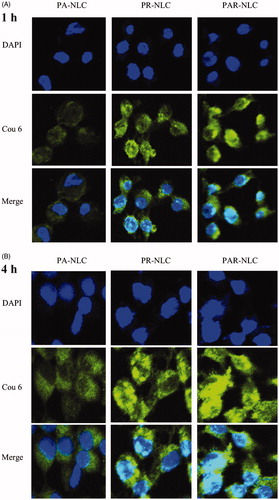
Figure 3. In vivo and ex vivo images of S180 tumor-bearing mice injected with Dir-loaded PA-NLC, R-NLC and PAR-NLC. The Dir concentration was 2.5 mg/kg. The maximum and minimum Dir signal was 900 and 4000, respectively.
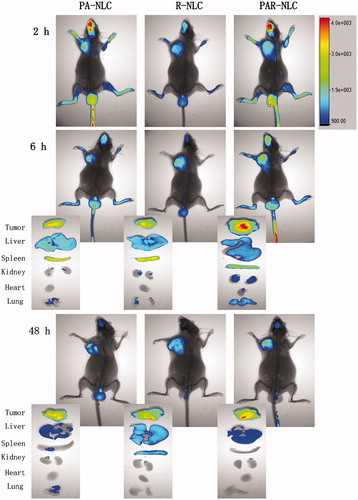
Figure 4. Morphology and in vitro drug release of PAR-NLC. (A) TEM image of PAR-NLC, the scale bar is 100 nm. (B) In vitro drug release of PAR-NLC, the result was presented as mean ± standard deviation (n = 3).
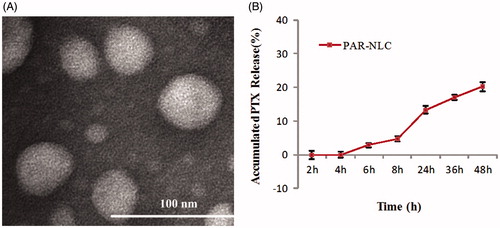
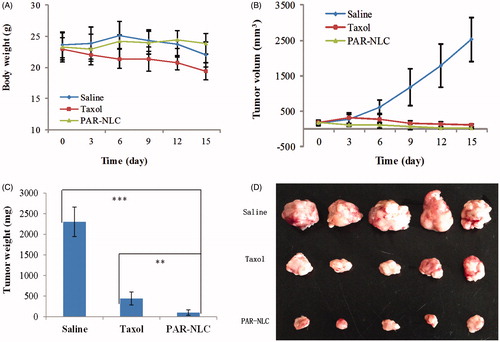
Figure 5. Antitumor effect of PAR-NLC and Taxol, the drugs were injected to S180 tumor-bearing mice through the tail vein at 10 mg/kg. The drug administration was conducted at 0, 3, 6, 9 and 12 days, and the mice were sacrificed at the Day 15. (A) Body weight. (B) Tumor volume. (C) Tumor weight after the sacrifice of the mice. (D) Image of the tumors in Saline, Taxol and PAR-NLC groups (n = 5).