Figures & data
Figure 1. SEM image of ChiNP/siRNA/DOX/CMD.
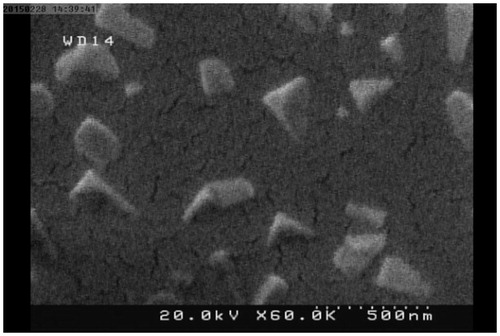
Table 1. Physical characteristics of ChiNPs with different pharmaceutical groups.
Figure 2. The FTIR spectrum of ChiNP/DOX/CMD (A), DOX (B), ChiNP/CMD (C) and CMD (D).
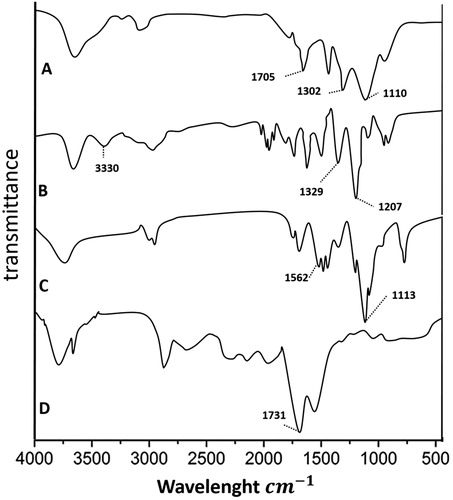
Figure 3. SiRNA loading capacity of ChiNP (140 kDa) with various IGF-1 R siRNA concentrations. Naked siRNA as control (CTRL), lane 1: 25 nM, lane 2: 50 nM and lane 3:100 nM.
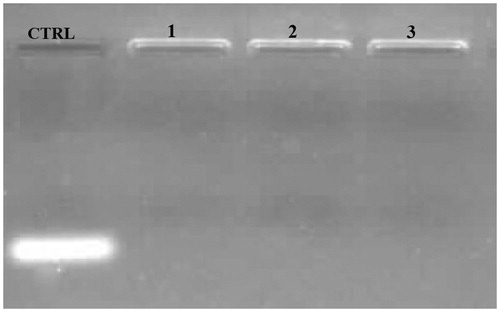
Figure 4. The stability analysis of siRNA-loaded ChiNPs in serum and heparin challenges. (A) The stability of siRNA-loaded ChiNP/CMD against FBS after 72 h incubation. Naked siRNA was considered as control (CTRL). (B) The stability of siRNA-loaded ChiNP/CMD against different volumes of heparin (2 μg/mL) after 1 h incubation. Naked siRNA was considered as positive control (CTRL).
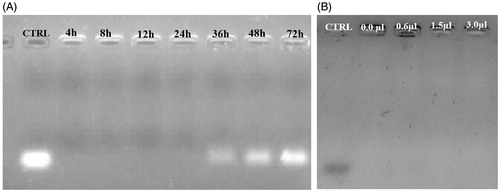
Figure 5. IGF-1R siRNA and DOX releasing assay at different time and pH conditions. (A) IGF-1R siRNA release curve of ChiNP/siRNA/CMD in PBS with pH 5.5 and 7.4. (B) DOX release curve of ChiNP/DOX/CMD in PBS with pH 5.5 and 7.4.
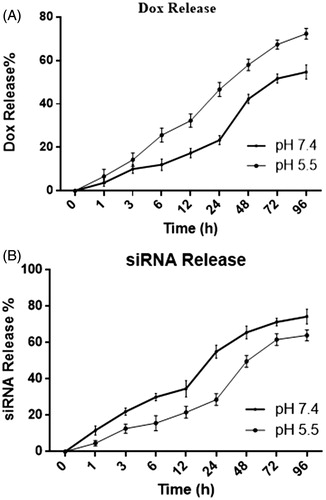
Figure 6. Combination of IGF-1R siRNA and DOX synergistically improved cytotoxicity in A549 human lung cancer cell line in a dose and time-dependent manner at 24 h (A) and 48 h (B). CTRL represents no treated cell control. Data shown as means ± SD of three independent experiments.
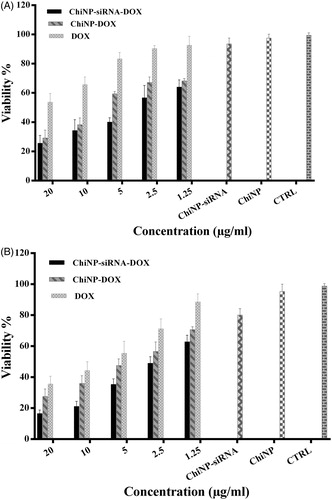
Figure 7. Flow cytometry of A549 cells using Annexin V–FITC, (A) no treatment, (B) treatment with Chi/CMD, (C) free DOX, (D) Chi/siRNA/CMD, (E) Chi/DOX/CMD and (F) Chi/siRNA/DOX/CMD.
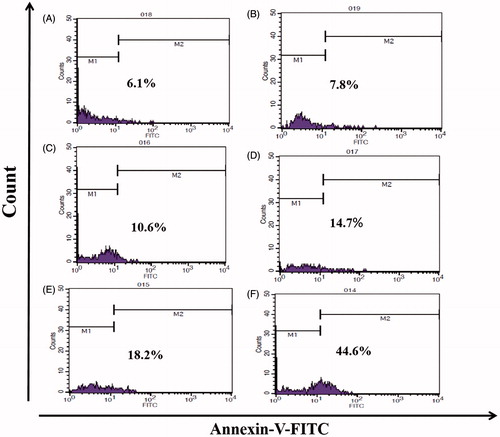
Figure 8. The effects of nanoparticles delivery of IGF-1R siRNA and DOX on apoptosis of A549 human non-small cell lung cancer cell. CTRL represents no treated cell control. Data shown as means ± SD of three independent experiments.
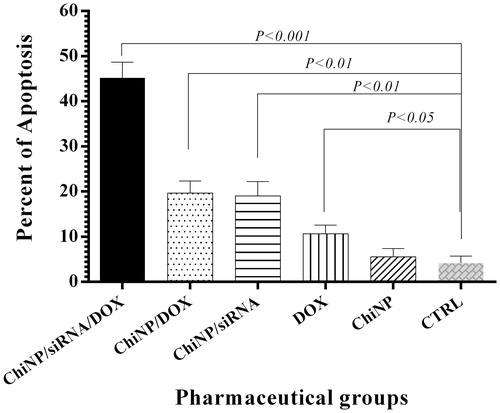
Figure 9. Impact of ChiNP/siRNA/DOX and free DOX on human non-small lung cancer A549 cells migration in wound-healing assay. Data shown as means ± SD of three independent experiments.
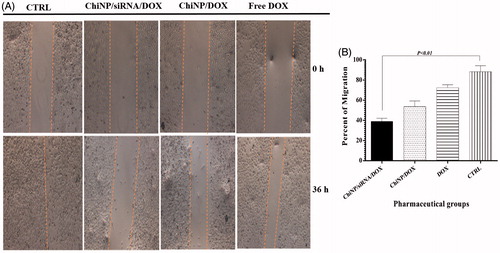
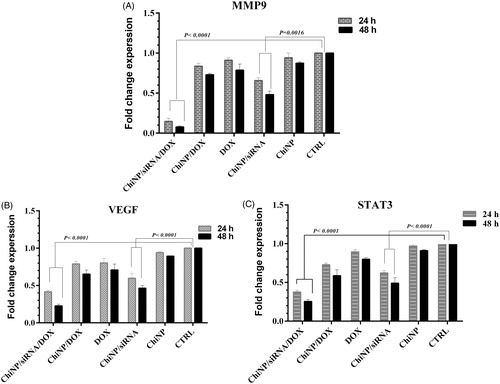
Figure 10. MMP-9, VEGF and STAT3 genes expression profiles in A549 human non-small cell lung cancer cell line treated with ChiNP with different pharmaceutical groups. (A) MMP-9; (B) VEGF; and (C) STAT3 gene expression alterations. Data shown as means ± SD of three independent experiments.