1,002
Views
24
CrossRef citations to date
0
Altmetric
Research-article

Electrokinetic potential-stabilization by bile acid-microencapsulating formulation of pancreatic β-cells cultured in high ratio poly-L-ornithine-gel hydrogel colloidal dispersion: applications in cell-biomaterials, tissue engineering and biotechnological applications

, , , , &
Pages 1156-1162 | Received 26 Jun 2017, Accepted 27 Jul 2017, Published online: 04 Aug 2017

Figures & data

Figure 1. Images of microcapsules (without ursodeoxycholic acid, control): (a) optical, (b) confocal, (c) scanning electron, (d-i) surface site used for EDXR analysis and (d-ii) atomic composition.
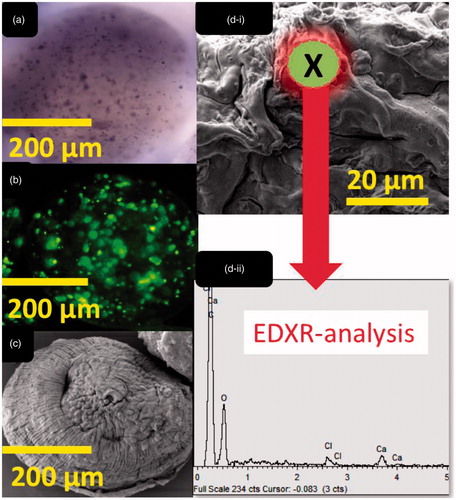
Figure 1. Images of microcapsules (without ursodeoxycholic acid, control): (a) optical, (b) confocal, (c) scanning electron, (d-i) surface site used for EDXR analysis and (d-ii) atomic composition.
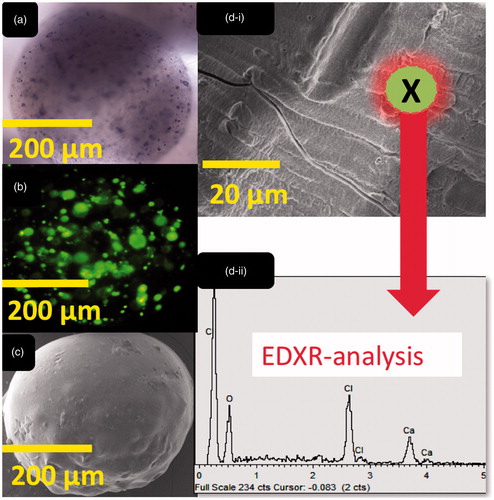
Figure 2. Images of microcapsules (with ursodeoxycholic acid, test): (a) optical, (b) confocal, (c) scanning electron, (d-i) surface site used for EDXR analysis and (d-ii) atomic composition.
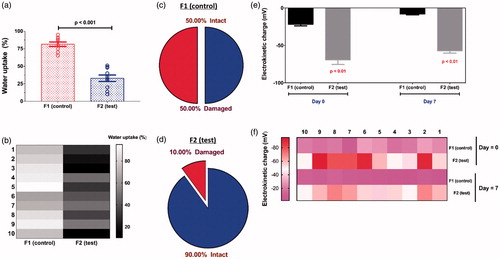
Figure 2. Images of microcapsules (with ursodeoxycholic acid, test): (a) optical, (b) confocal, (c) scanning electron, (d-i) surface site used for EDXR analysis and (d-ii) atomic composition.

Figure 3. Water uptake (a), Heat map plot of water uptake (b), mechanical stability of control (c), mechanical stability of test (d), Zeta-potential assessments at day 0 and day 7 (e) and heat map analysis of Zeta potentials at day 0 and day 7 (f). Data are expressed as data ± SEM, n = 3.

Figure 3. Water uptake (a), Heat map plot of water uptake (b), mechanical stability of control (c), mechanical stability of test (d), Zeta-potential assessments at day 0 and day 7 (e) and heat map analysis of Zeta potentials at day 0 and day 7 (f). Data are expressed as data ± SEM, n = 3.

Figure 4. (a) cell viability, (b) insulin output, (c) resting metabolism, (d) maximum metabolism, (e) energy production, (f) anaerobic metabolism, (g) tumour necrosis factor-α (TNF-α) levels, (h) interleukin-6 (IL-6) levels, (i) interferon-γ (IFN-γ) levels and (j) interleukin-1β (IL-1β) levels.

Figure 4. (a) cell viability, (b) insulin output, (c) resting metabolism, (d) maximum metabolism, (e) energy production, (f) anaerobic metabolism, (g) tumour necrosis factor-α (TNF-α) levels, (h) interleukin-6 (IL-6) levels, (i) interferon-γ (IFN-γ) levels and (j) interleukin-1β (IL-1β) levels.

Reprints and Corporate Permissions

Please note: Selecting permissions does not provide access to the full text of the article, please see our help page How do I view content?

To request a reprint or corporate permissions for this article, please click on the relevant link below:

Academic Permissions

Please note: Selecting permissions does not provide access to the full text of the article, please see our help page How do I view content?

Obtain permissions instantly via Rightslink by clicking on the button below:

If you are unable to obtain permissions via Rightslink, please complete and submit this Permissions form. For more information, please visit our Permissions help page.