Figures & data
Scheme 1. Schematic illustration of MPN@HMMEs synthesis and for selective PDT against cancer. HMME was encapsulated into PEG-MPN to form MPN@HMMEs. After FR-mediated endocytosis, MPN@HMMEs are dissociated in lysosomes to release photosensitizers to cytoplasm, followed by PDT with 638 nm laser to kill carcinoma cells.
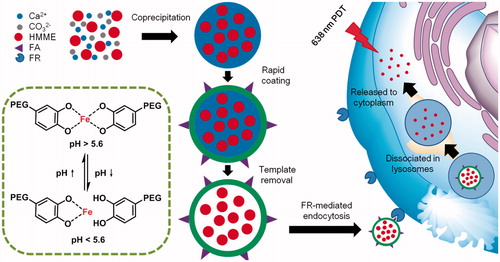
Figure 1. MPN@HMMEs before (a–f) or after (g–l) removing the templates observed by SEM (a, g), reversed biological microscopy (b, h), DIC microscopy (c, i) and fluorescence microscopy (d–f, j–l). Scale bars are 3 μm.
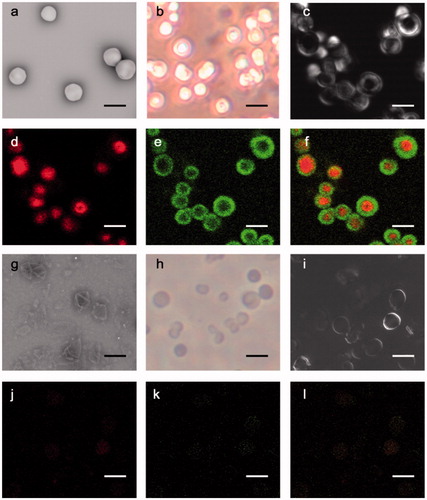
Figure 2. (a) Release of encapsulated HMME from MPN@HMMEs (3 μg mL−1) at pH 7.4 and 5.0 in 37 °C, respectively. The normalized fluorescence intensity from HMME in MPN@HMMEs was monitored by fluorescent spectrometry, λex = 392 nm, λem = 620 nm; (b) plots of fluorescence ratio of I620 nm/I670 nm versus pH, λex = 392 nm.
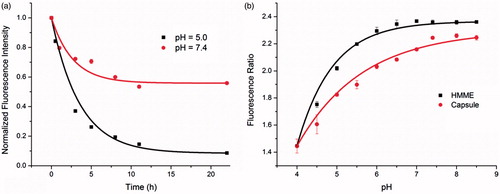
Figure 3. Viability of HeLa cells treated with capsules or FA-doped capsules under different concentration before and after PDT with irradiation dose of 18 J cm−2.
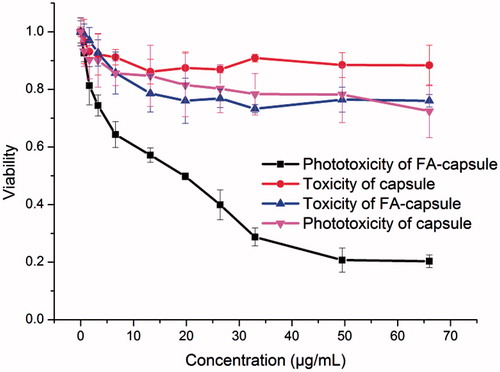
Figure 4. Flow cytometric detection of HeLa cell apoptosis induced by capsule-mediated PDT. HeLa cells (1 × 10⁵) per well were seeded on six-well cell culture clusters and incubated in complete medium for 24 h at 37 °C, then incubated with MPN@HMMEs (30 μg mL−1) for 4 h at 37 °C. The cells were irradiated with a 638 nm laser at an energy density of 0 (c), 20 (d), 40 (e) and 80 (f) J cm−2, respectively. The HeLa cells untreated (a) and irradiated (b) used as controls.
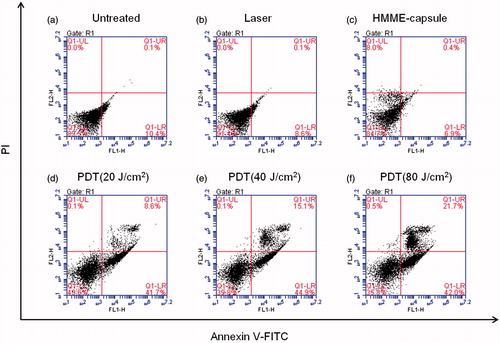
Figure 5. CLSM analysis of capsules’ targeting ability. HeLa (FR+), HaCaT (FR−) or A549 (FR+) cells were incubated with 30 μg mL−1 FITC-labelled MPN@HMMEs (a) for 4 h at 37 °C; HeLa, HaCaT or A549 cells were incubated with 30 μg mL−1 of MPN@HMMEs (b) and HMME (c), respectively, followed by irradiation with a 638 nm laser at energy density of 40 J cm−2 and Annexin V-FITC/PI staining. Scale bars are 30 μm.
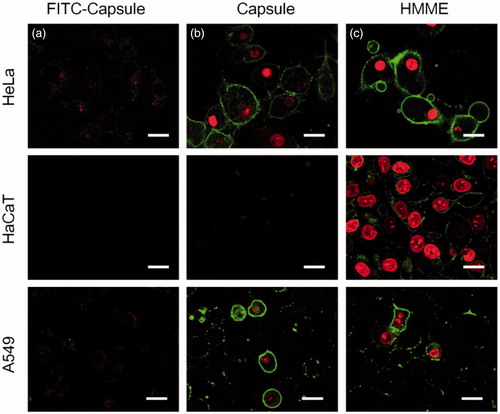
Figure 6. Flow cytometric detection of ROS generated during capsule-mediated PDT with a ROS probe, DCFH-DA. HeLa cells (1 × 10⁵) per well were seeded on six-well cell culture clusters and incubated in complete medium for 24 h at 37 °C, then incubated with MPN@HMMEs (30 μg mL−1) for 4 h at 37 °C. HeLa cells were incubated with 10 μM DCFH-DA for 20 min and irradiated with a 638 nm laser at energy densities of 0, 5, 10, 15 J cm−2; and plot of ROS generation versus irradiation dose of 638 nm laser, ROS generation was defined as the ratio of mean fluorescent intensity of DCF at different irradiation dose to the control (inset graph).
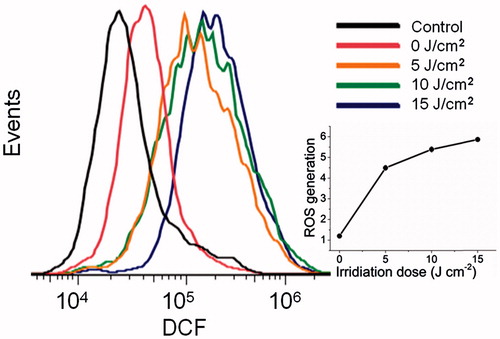
Figure 7. Confocal fluorescence images of Annexin V-FITC/PI stained HeLa cells with different treatments: (a) the capsule-loaded HeLa cells were incubated without (b) or with NAC (c) or vitamin C (d) followed by irradiation with 20 J cm−2 638 nm laser. Untreated HeLa cells set as control. Scale bars are 30 μm.
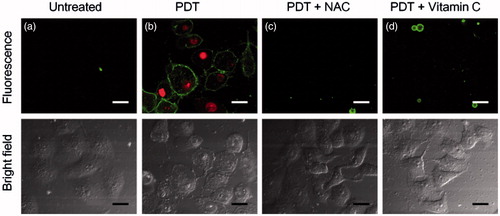
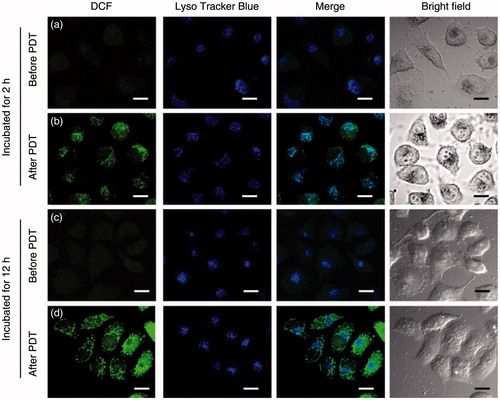
Figure 8. Subcellular localization of ROS generated during capsule-mediated PDT. HeLa cells were incubated with MPN@HMMEs (30 μg mL−1) for 2 (a, b) or 12 (c, d) h, followed by DCFH-DA and LysoTracker Blue staining for 15 min with irradiation dose of 20 J cm−2. Scale bars are 30 μm.