
Figures & data
Table 1. Summary of the chemical structures of the most widely applied NCPs and their related applications in biomedicine.
Figure 1. Gelatin’s intrinsic cationic nature at pH values below its isoelectric point.
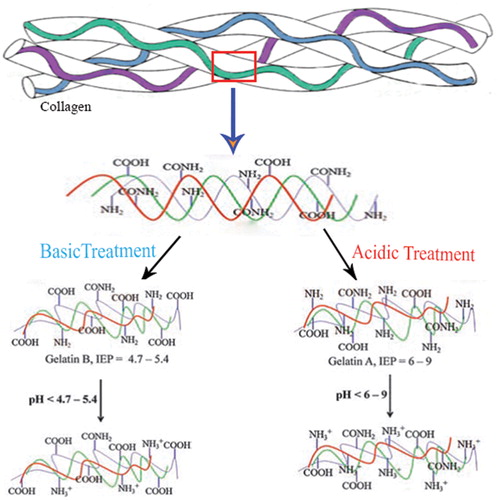
Figure 2. Chitosan’s inherent cationic nature below its pKa. At lower pH about 6 chitosan’s amine groups are protonated giving poly-cationic behaviour to chitosan (Right). At pH about 6.5, chitosan’s amines are deprontonated and result in insoluble chitosan (left).
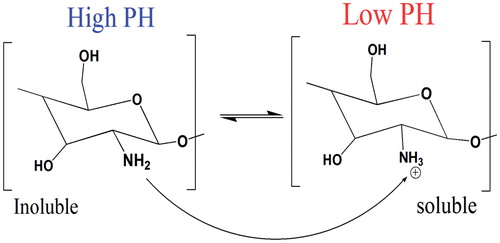
Figure 3. Cytotoxicity effect of different concentrations of AN–CS–Arg/Cur nanoparticles in HT-29 cells. (Republished with permission of [DOVE Medical Press], from Ref. [Citation51] Copyright (2016); permission conveyed through Copyright Clearance Centre, Inc.).
![Figure 3. Cytotoxicity effect of different concentrations of AN–CS–Arg/Cur nanoparticles in HT-29 cells. (Republished with permission of [DOVE Medical Press], from Ref. [Citation51] Copyright (2016); permission conveyed through Copyright Clearance Centre, Inc.).](/cms/asset/9d5e3ea1-5a4a-4a96-bb4c-acf8f252c41e/ianb_a_1395344_f0003_c.jpg)
Figure 4. (A) Particle size determination of Chitosan nanoparticle conjugated with folic acid (CSF)/conjugated with peptide (CSP) by high resolution transmission electron microscope (HR-TEM), scanning electron microscope (FESEM), dynamic light scattering. (B) surface charge determination by zeta potential, (C) percentage of drug release by the CSF and CSP NPs. (Reprinted from Ref. [Citation54] Copyright 2016, with permission from Elsevier.)
![Figure 4. (A) Particle size determination of Chitosan nanoparticle conjugated with folic acid (CSF)/conjugated with peptide (CSP) by high resolution transmission electron microscope (HR-TEM), scanning electron microscope (FESEM), dynamic light scattering. (B) surface charge determination by zeta potential, (C) percentage of drug release by the CSF and CSP NPs. (Reprinted from Ref. [Citation54] Copyright 2016, with permission from Elsevier.)](/cms/asset/af8b939b-b00e-4d60-be40-7378cc9b5174/ianb_a_1395344_f0004_b.jpg)
Figure 5. SEM images of pure ZnO nanoparticles (A), pure CMC hydrogel beads (B) and CMC/ZnO-PPN bionanocomposite beads (C). (Reprinted from Ref. [Citation60] Copyright 2016, with permission from Elsevier.)
![Figure 5. SEM images of pure ZnO nanoparticles (A), pure CMC hydrogel beads (B) and CMC/ZnO-PPN bionanocomposite beads (C). (Reprinted from Ref. [Citation60] Copyright 2016, with permission from Elsevier.)](/cms/asset/dd5ece64-030d-4499-9ac8-f53504711902/ianb_a_1395344_f0005_c.jpg)
Figure 6. Confocal microscopy images of PC-3, DU 145 and HT-29 cells without any treatment as control (CTL), Cur, Cur–CD and Cur–CD/CNCx (50 lM). Green fluorescence appears due to curcumin. (Reprinted from Ref. [Citation62] Copyright 2016, with permission from Elsevier.)
![Figure 6. Confocal microscopy images of PC-3, DU 145 and HT-29 cells without any treatment as control (CTL), Cur, Cur–CD and Cur–CD/CNCx (50 lM). Green fluorescence appears due to curcumin. (Reprinted from Ref. [Citation62] Copyright 2016, with permission from Elsevier.)](/cms/asset/b038405a-a3e6-4597-9f3c-ec219c6ee0e8/ianb_a_1395344_f0006_c.jpg)
Table 2. Summary of the chemical structures of the most widely applied synthetic cationic polymers and their related applications in biomedicine.
Figure 7. Schematic illustration of (A) Reactions of side chains of PDMAEMA on nanoparticles’ surface upon CO2 and N2 bubbling; (B) dispersion of nanoparticles in the presence/absence of CO2 (Reprinted from Ref. [Citation98] Copyright 2013, with permission from Elsevier.)
![Figure 7. Schematic illustration of (A) Reactions of side chains of PDMAEMA on nanoparticles’ surface upon CO2 and N2 bubbling; (B) dispersion of nanoparticles in the presence/absence of CO2 (Reprinted from Ref. [Citation98] Copyright 2013, with permission from Elsevier.)](/cms/asset/76cec08d-1c26-450e-b40b-ca27ab710b61/ianb_a_1395344_f0007_c.jpg)
Figure 8. Taken images of the tumours (A) removed from mice at the end point of the research. Tumour-growth changes (B) and body weight changes (C) of tumour-bearing BALB/c mice after tail vein injection of normal saline (square), free DOX (circle) and DOX-NPs (or DNP) (triangle) (at a DOX dose of 4 mg kg−1). The arrow indicates the beginning time points of the drug injection and the drug injection was repeated every three days. (Reprinted from Ref. [Citation99] Copyright 2014, with permission from Elsevier.)
![Figure 8. Taken images of the tumours (A) removed from mice at the end point of the research. Tumour-growth changes (B) and body weight changes (C) of tumour-bearing BALB/c mice after tail vein injection of normal saline (square), free DOX (circle) and DOX-NPs (or DNP) (triangle) (at a DOX dose of 4 mg kg−1). The arrow indicates the beginning time points of the drug injection and the drug injection was repeated every three days. (Reprinted from Ref. [Citation99] Copyright 2014, with permission from Elsevier.)](/cms/asset/45d41f7d-b03e-44c4-8e9b-e353f4640262/ianb_a_1395344_f0008_c.jpg)
Figure 9. Synthesis process for preparation of PLL.
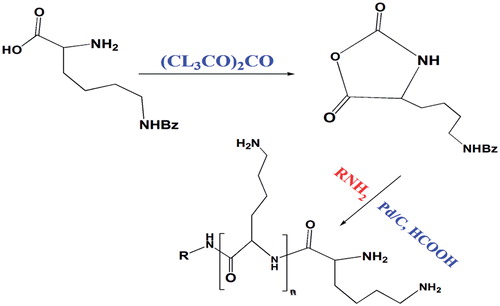
Figure 10. Schematic illustration of shell cross-linked polycationic peptide guided lung deposition and alveoli permeation of self-assembled insulin nanospheres. (Reprinted from Ref. [Citation106] Copyright 2014, with permission from Elsevier.)
![Figure 10. Schematic illustration of shell cross-linked polycationic peptide guided lung deposition and alveoli permeation of self-assembled insulin nanospheres. (Reprinted from Ref. [Citation106] Copyright 2014, with permission from Elsevier.)](/cms/asset/59c42891-350b-4d75-9ca0-786a3f5ca099/ianb_a_1395344_f0010_c.jpg)
Figure 11. Representative images for lung deposition of INS (A) and INS@EPL (B) after intratracheal administration in rats. The images were merged from RGB and optical spectra. (Reprinted from Ref. [Citation106] Copyright 2014, with permission from Elsevier.)
![Figure 11. Representative images for lung deposition of INS (A) and INS@EPL (B) after intratracheal administration in rats. The images were merged from RGB and optical spectra. (Reprinted from Ref. [Citation106] Copyright 2014, with permission from Elsevier.)](/cms/asset/f6a42121-b983-4c3a-b300-7bfffb635119/ianb_a_1395344_f0011_c.jpg)
Figure 12. Synthesis of (A) LPEI by acid hydrolysis of poly(2-ethyl-2-oxazoline) (B) BPEI by acid-catalyzed polymerization of aziridine.
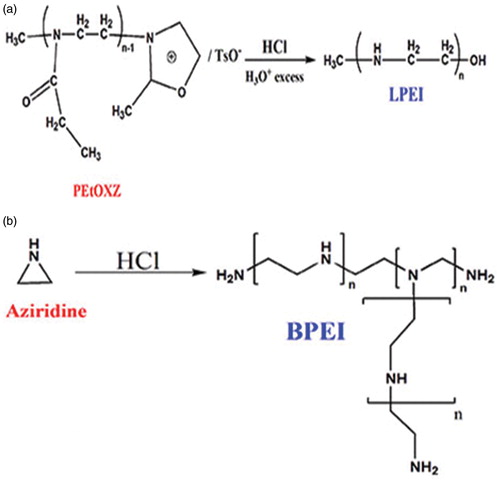
Figure 13. Synthesis scheme of PEI–PEG.
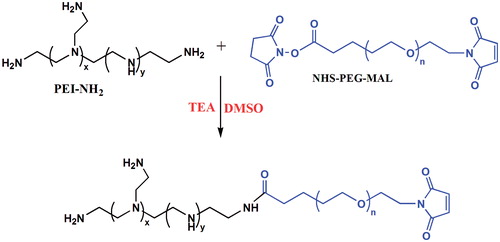
Figure 14. Schematic illustration of the eHER-PPNs. (Reprinted from Ref. [Citation114] Copyright 2016, with permission from Elsevier.)
![Figure 14. Schematic illustration of the eHER-PPNs. (Reprinted from Ref. [Citation114] Copyright 2016, with permission from Elsevier.)](/cms/asset/0721927e-b4f4-4d5d-a71f-6071e490e00d/ianb_a_1395344_f0014_c.jpg)
Figure 15. Characterization of C60-PEI-FA/DTX (A): AFM images of C60-PEI-FA/DTX; (B): TEM images of C60-PEI-FA/DTX. (Reprinted from Ref. [Citation115] Copyright 2012, with permission from Elsevier.)
![Figure 15. Characterization of C60-PEI-FA/DTX (A): AFM images of C60-PEI-FA/DTX; (B): TEM images of C60-PEI-FA/DTX. (Reprinted from Ref. [Citation115] Copyright 2012, with permission from Elsevier.)](/cms/asset/1eae04ea-ea09-45f8-84ab-0a20fce84ec9/ianb_a_1395344_f0015_c.jpg)
Figure 16. Reaction process for the synthesis of linear PAMAM. R1, R2, R3 and R4 can be any alkyl residues in order to incorporate ketals, acetals, carboxyl, amide and ester groups.
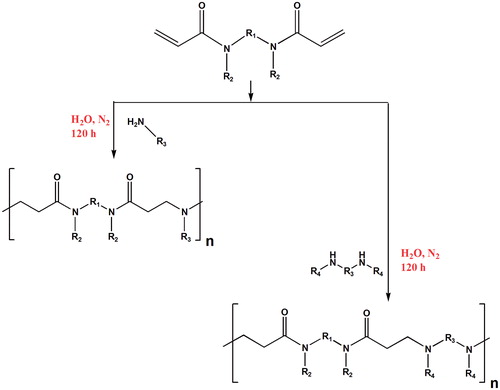
Figure 17. (A) Representative AO/EB (green/red dye) dual staining images of untreated, IC50 and 2 × IC50 5-FU@DsAgNC treated A549 and MCF-7 cells. EA and LA represent early apoptotic and late apoptotic cells, respectively. Scale bar: 100 μm. (B) FE-SEM images of untreated and IC50 5-FU@DsAgNC treated A549 and MCF-7 cells, respectively. (Reprinted from Ref. [127] with permission from The Royal Society of Chemistry.)
![Figure 17. (A) Representative AO/EB (green/red dye) dual staining images of untreated, IC50 and 2 × IC50 5-FU@DsAgNC treated A549 and MCF-7 cells. EA and LA represent early apoptotic and late apoptotic cells, respectively. Scale bar: 100 μm. (B) FE-SEM images of untreated and IC50 5-FU@DsAgNC treated A549 and MCF-7 cells, respectively. (Reprinted from Ref. [127] with permission from The Royal Society of Chemistry.)](/cms/asset/bf0861da-0cd2-4251-891c-b77d3683ca93/ianb_a_1395344_f0017_c.jpg)