Figures & data
Scheme 1. Schematic illustration of the synthesis of GO-Fe3O4, PEC-GO-Fe3O4 and PEC-GO-Fe3O4-PAC.
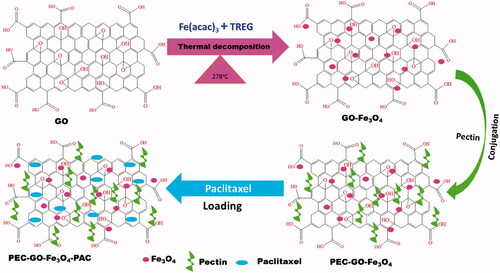
Figure 1. FTIR spectra of GO-Fe3O4, PEC and PEC-GO-Fe3O4.
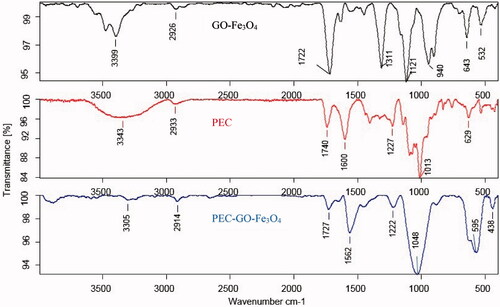
Figure 2. XRD spectrum of GO, GO-Fe3O4 and PEC-GO-Fe3O4.
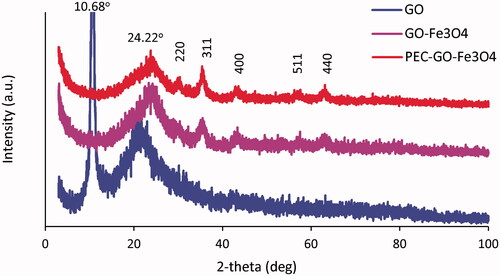
Figure 3. TEM images of GO (a), GO-Fe3O4 (b) and PEC-GO-Fe3O4 (c).
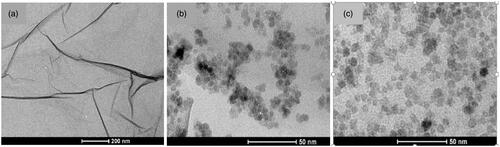
Table 1. The average particle size and polydispersity index of GO-Fe3O4, GO-Fe3O4-PEC, GO-Fe3O4-PEC-PAC.
Figure 4. The magnetization hysteresis loop of PEC-GO-Fe3O4 and PEC-GO-Fe3O4-PAC at room temperature, between −2000 and +2000 Oe.
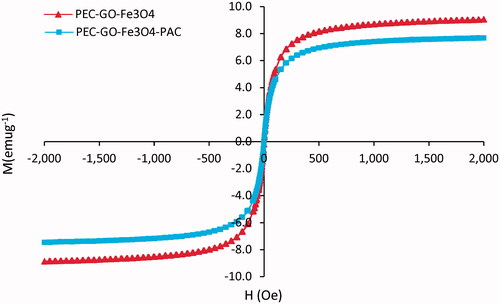
Figure 5. TGA thermogram of PEC (a) and PEC-GO-Fe3O4 (b).
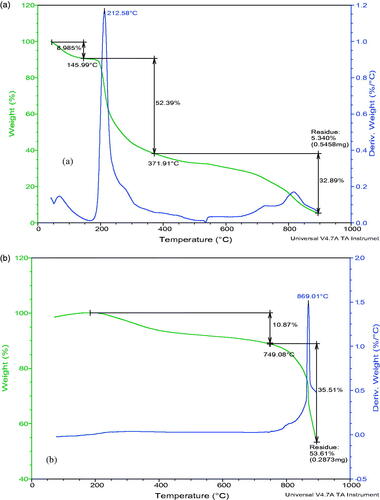
Figure 6. The LC% and EE% of GO-Fe3O4 and PEC-GO-Fe3O4. Data were given as mean ± SD (n = 3).
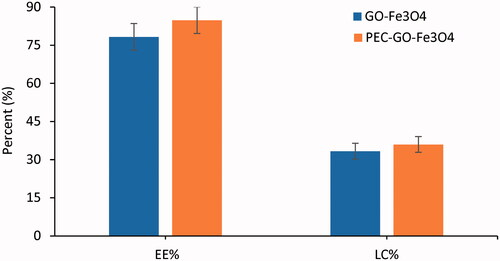
Figure 7. PAC release from GO-Fe3O4-PAC and PEC-GO-Fe3O4-PAC (a) at pH 7.4 and (b) at pH 5.5. Results were expressed as the mean ± SD of n = 3, p < .05.
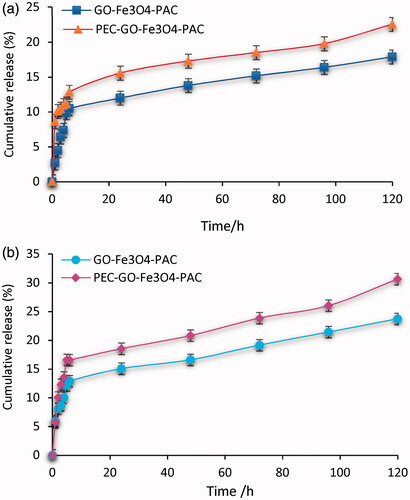
Table 2. Release exponent (n), calculated from paclitaxel release profile using Korsmeyer–Peppas model.
Figure 8. Relative cell viability of GO-Fe3O4 and PEC-GO-Fe3O4 treated with L-929 fibroblast normal cell. Data were revealed as the means ± SD (n = 3).
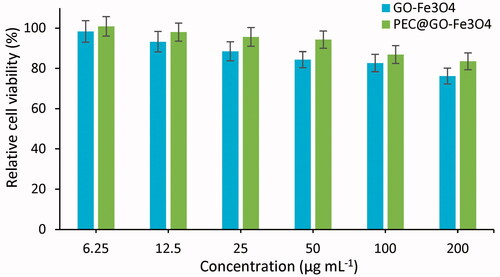
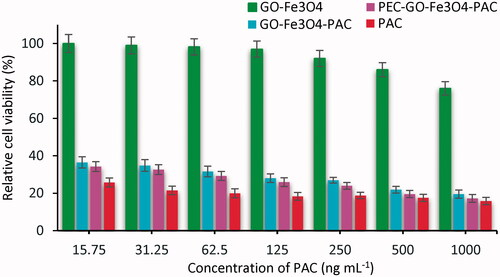
Figure 9. Relative cell viability of GO-Fe3O4-PAC and PEC-GO-Fe3O4-PAC treated with MCF-7 cancer cell. The points were expressed as mean ± SD of (n = 3).