Figures & data
Scheme 1. Schematic illustration of the synthesis of 99mTc-Au-Ac-PENPs and 99mTc-Au-Gly-PENPs.
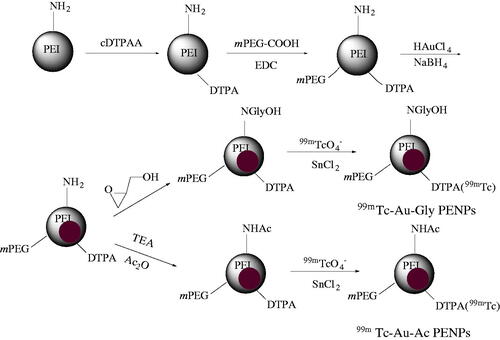
Figure 1. (a,c) TEM images, (b,d) size distribution, (e,f) selected area electron diffraction pattern and (G,H) UV-vis spectra of Au-Ac-PENPs (a, b, c, and g) and Au-Gly-PENPs (c, d, f, and h), respectively.
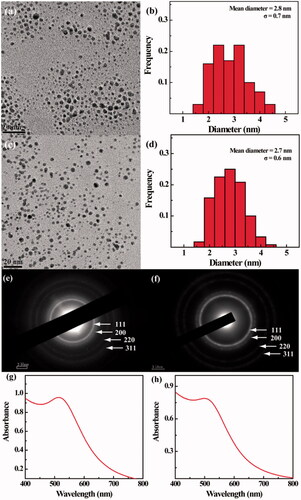
Figure 2. (a) Haemolytical activity of Au-Ac-PENPs and Au-Gly-PENPs under different concentrations. (b) MTT assay of the viability of SKOV-3 cells treatment with Au-Ac-PENPs and Au-Gly-PENPs at the Au concentrations of 0–100 μM for 24 h. (c) Haematology and blood biochemistry data of the mice treated with saline (control group), Au-Ac-PENPs, and Au-Gly-PENPs.
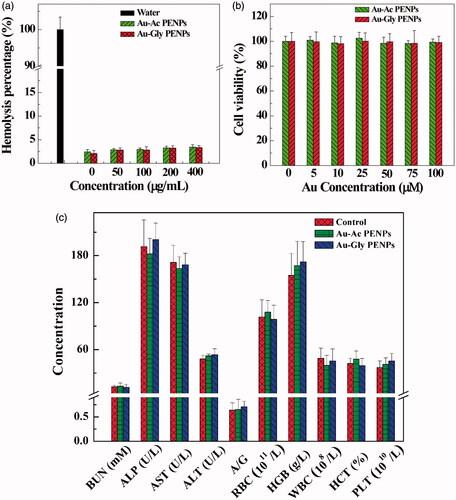
Figure 3. SPECT/CT images of a mouse lung, liver, and bladder at (a) 0.5 h, (b)1 h, and (c) 2 h post intravenous injection of 99mTc-Au-Ac-PENPs; SPECT/CT images of a mouse heart, liver, spleen, kidneys, postcaval vein, and bladder at (d) 0.5 h, (e)1 h, and (f) 2 h post intravenous injection of 99mTc-Au-Gly-PENPs.
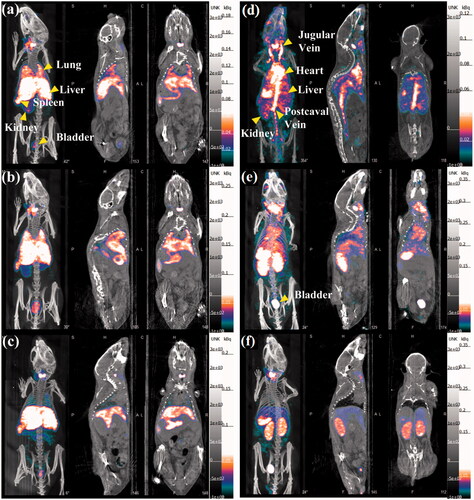
Figure 4. SPECT signal intensity of different organs at different time points post intravenous injection of (a) 99mTc-Au-Ac-PENPs and (b) 99mTc-Au-Gly-PENPs.
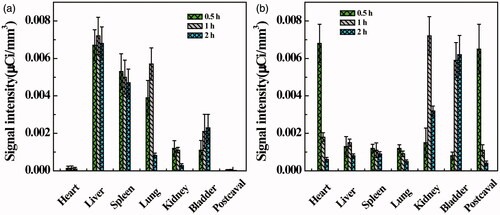
Figure 5. Micro-CT images of a mouse lung, liver, and kidneys (a) before and at (b) 0.5 h, (c) 1 h, and (d) 2 h post intravenous injection of Au-Ac-PENPs. Micro-CT images of a mouse heart, liver, kidneys and postcaval vein (e) before and at (f) 0.5 h, (g) 1 h, and (h) 2 h post intravenous injection of Au-Gly-PENPs.
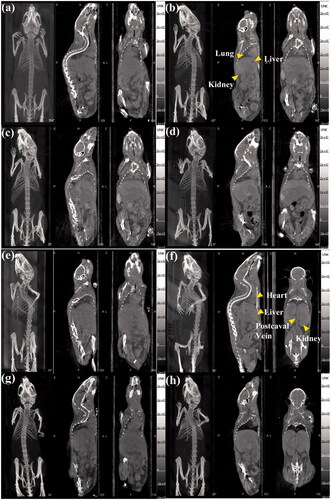
Figure 6. Relative CT value of different organs before and at different time points post intravenous injection of (a) Au-Ac-PENPs and (b) Au-Gly-PENPs. Biodistribution of 99mTc-Au-PENPs in the blood, muscle, and major organs of the mice at different time points post intravenous injection of (c) 99mTc-Au-Ac-PENPs and (d) 99mTc-Au-Gly-PENPs.
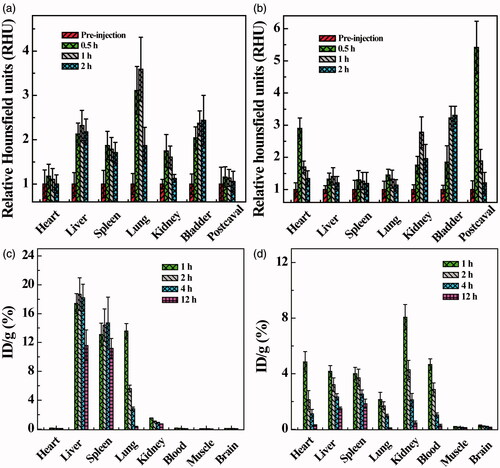
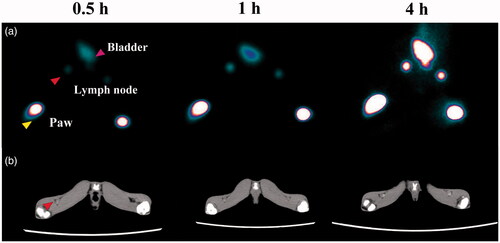
Figure 7. (a) SPECT and (b) CT imaging of a rabbit lymph node after hock injection of 99mTc-Au-Ac-PENPs (right) and 99mTc-Au-Gly-PENPs (left) at different time points postinjection.