Figures & data
Scheme 1. hUC-MSCs-Tf-inspired-NPs transport process, consists of spontaneous incubation of Tf-inspired NPs and hUC-MSCs. After in vivo injection, loaded hUC-MSCs migrate to tumor cells and exhibit tumor specificity and then release their original form of complex or free DOX.
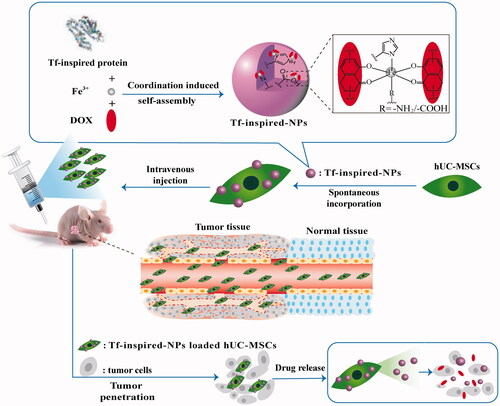
Table 1. Forward and reverse primer sequences used for reverse transcriptase PCR.
Figure 1. Characterization of hUC-MSCs. (a) Phase-contrast image of isolated hUC-MSCs (passage 3) showing homogeneous fibroblast-like cells. Magnification: 10×; scale bar =100 μm. (b) Immunophenotyping for isolated hUC-MSCs; cells were labeled with FITC and examined by flow cytometer. The immunophenotyping profile of hUC-MSCs showed negative for CD34 and CD11b but positive for CD44 and CD90. (c) mRNA expression in different hUC-MSCs populations (p0, p3 and p5) by real-time PCR (***p < .001 compared to the control). (d–i) Successfully differentiated into, adipocytes (stained red with Oil Red), osteoblasts (stained with Alizarin Red) and chondrocyte (stained with Alcian 8GX blue Alizarin Red) cells. Scale bar =100 μm. (j) Scanning electron microscopy (SEM) image of Tf-inspired-NPs. (k) Histogram of particle-size distribution of Tf-inspired-NPs obtained by dynamic light scattering measurements (DLS).
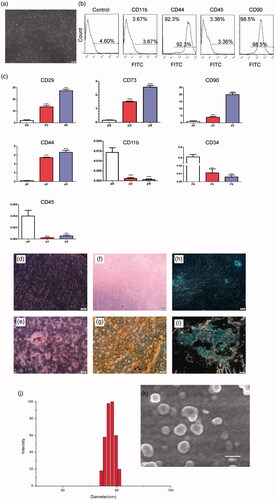
Figure 2. Influence of the drugs on hUC-MSCs cells viability. hUC-MSCs were co-cultured with Tf-inspired-NPs (a), DOX (b) and Tf-inspired protein/Fe3+ (c) for 6 h to investigate cytotoxicity. Influence of the drugs uptake on hUC-MSCs cell survival (d). hUC-MSCs were incubated at 37 °C with 50 μg/mL DOX, Tf-inspired protein/Fe3+ and Tf-inspired-NPs. After 1, 3 and 5 days, cell survival was determined. Viability of the control group receiving none drugs was considered as 100%. Data were expressed as mean ± standard deviation (n = 3). *p < .05, **p < .01 and ***p < .001.
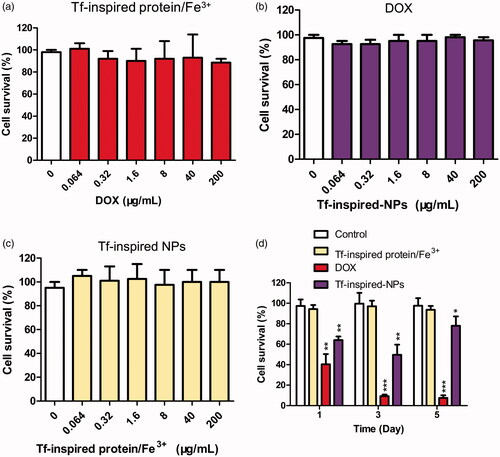
Figure 3. Total cellular uptake of free DOX and Tf-inspired-NPs by hUC-MSCs. (a) Depicts the incubation time-dependent manner of hUC-MSCs uptake; (b) Reports the mean fluorescence intensity of DOX and Tf-inspired-NPs under different drug concentration. Data is expressed as mean ± standard deviation (n = 3), ***p < .001.
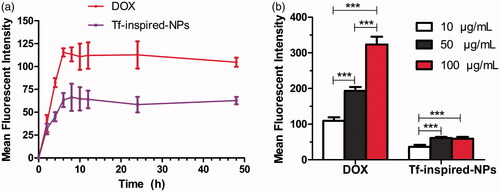
Figure 4. Drug loading (a) and in vitro release (b) of doxorubicin from hUC-MSCs-DOX and hUC-MSCs-Tf-inspired-NPs. SEM images of the supernatant of hUC-MSCs-DOX (c) and hUC-MSCs-Tf-inspired-NPs (d) post 6 h culturing. Data was expressed as mean ± standard deviation (n = 3), *p < .05.
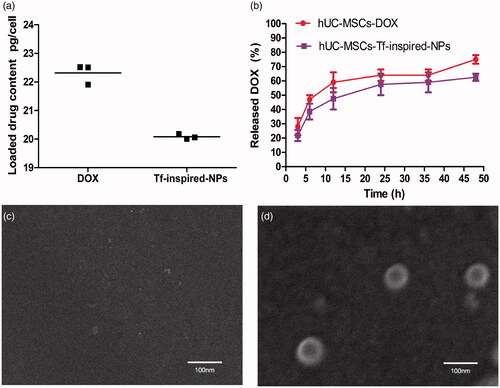
Figure 5. (a) Impact of uploading drug on hUC-MSCs migration. Typical photos of loaded and unloaded hUC-MSCs migration through the membrane pores; (b) OD570 value of stain crystal violet in each group. 0.5% serum was used as control group. Data were presented as mean ± standard deviation, (n = 6 replicates for each group), *p < .05, **p < .01, ***p < .001.
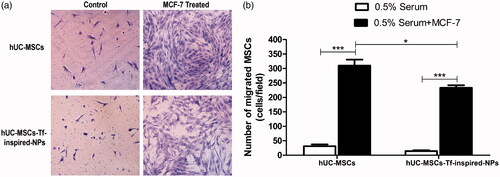
Figure 6. In vivo distribution of DiR-hUC-MSCs. (a) In vivo images (side view) of mice bearing MCF-7 tumors at 24 h after DiR-hUC-MSCs injection. (b) Ex vivo images of tumors and major organs at 24 h after hUC-MSCs injection.
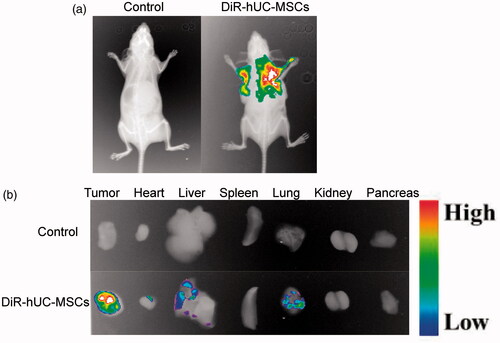
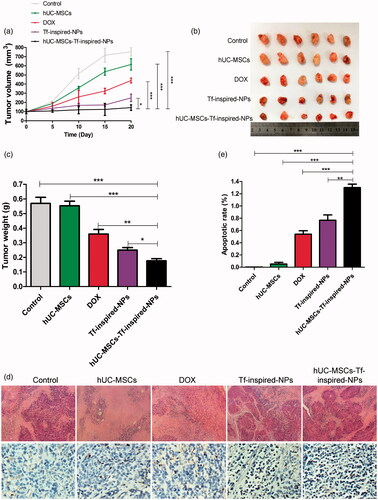
Figure 7. In vivo anti-tumor effects. (a) The tumor growth curves of mice after various treatments (n = 6, *p < .05, **p < .01, ***p < .001). (b) Tumor tissue images and (c) tumor weights of MCF-7 bearing female BALB/c nude mice treated with different formulations after a schedule of multiple dose (n = 6). (d) H&E and TUNEL staining of tumor (scale bar: 100 μm). (e) Integrated optical density (IOD) value of TUNEL-position area in the section area. Mean ± standard deviation (n = 3, *p < .05, **p < .01, ***p < .001).