Figures & data
Figure 1. Schematic representation of the experimental model. Time course study of arthritis induction and treatment with reference drug MTX and AuNGs in collagen-induced arthritic rats.
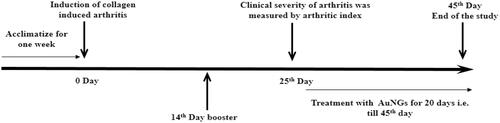
Table 1. Sequence of primers used in quantitative real-time PCR.
Figure 2. Characterization of AuNGs. (A) X-ray diffraction pattern of AuNGs was recorded at room temperature using Rigaku Miniflex X-ray diffractometer with Cu-Kα radiation (λ = 1.54060 Å) in 2θ ranging from 20° to 80°; (B) DLS measured the hydrodynamic radii of AuNGs. Samples of AuNGs were prepared in 20 mM phosphate buffer, pH 7.0 and sonicated well before measurements; (C) TEM images of AuNGs was recorded with a JEOL JEM-2100F transmission electron microscope with an accelerating voltage of 200 kV.
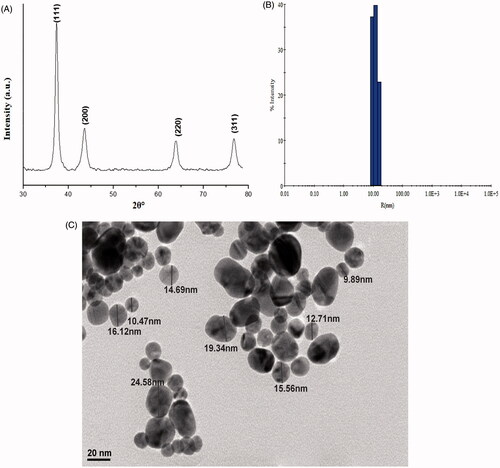
Figure 3. Effect of different doses of AuNGs on foot pad swelling (A) and arthritic index (B). *Significantly different from control; #significantly different from induced group (p < .05); ***p < .05.
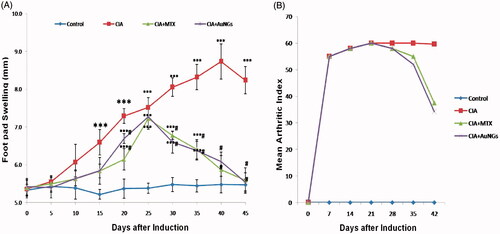
Figure 4. Effect of AuNGs on TNF-α (A), IL-1β (B), NF-kB (C) and COX-2 (D). *Significantly different from control (p < .05); #significantly different from induced group (p < .05). Data are expressed as mean ± SD (n = 6) and analyzed by one-way ANOVA followed by Tukey's multiple range test.
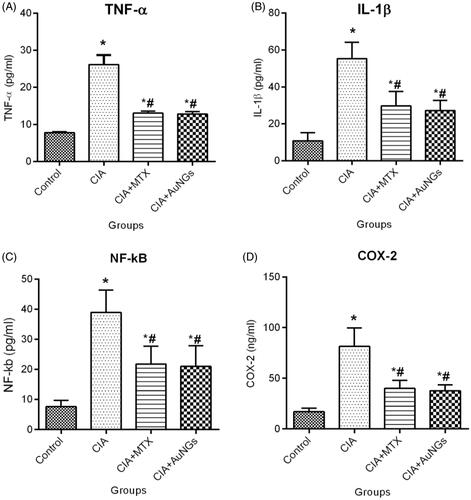
Figure 5. Effect of AuNGs on MDA (A) GSH (B). *Significantly different from control (p < .05); #significantly different from induced group (p < .05). Data are expressed as mean ± SD (n = 6) and analyzed by one-way ANOVA followed by Tukey's multiple range test.

Figure 6. Effect of AuNGs on mRNA expression (fold change) in joints of CIA rats, TNF-α (A) NF-kB (B) COX-2 (C) iNOS (D). *Significantly different from control (p < .05); #significantly different from induced group (p < .05). Data are expressed as mean ± SD (n = 6) and analyzed by one-way ANOVA followed by Tukey's multiple range test.
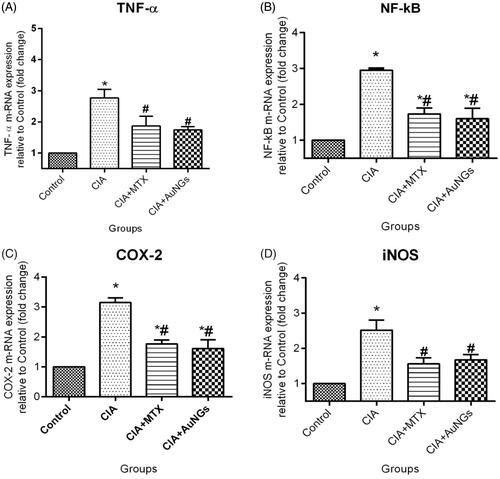
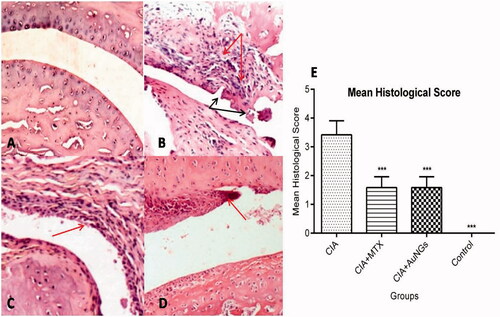
Figure 7. Histological examination of swollen paw. Normal architecture of knee joints in control rats (A), massive influx of inflammatory cells (Red arrow) and cartilage destruction (Black arrow) in CIA rats (B), show significant less influx of inflammatory cells and inflammation in MTX (C) and AuNGs treated rats (D). Mean histological score is shown in (E). ***p < .05.