Figures & data
Table 1. Real-time quantitative PCR primer.
Figure 1. Size and morphology characterization of CurChr-PLGA/PEG NPs using (A) DLS and (B) FE-SEM. (A) The encapsulation efficiencies for Cur NPs, Chr NPs and CurChr NPs were 78.27, 83.5 and 67.45%, respectively. Moreover, loading capacities of these drug formulations in the same order were determined 12.6 ± 2.5 (%) 10.3 ± 3.2 (%) and 9.86 ± 2.1 (%), respectively. (B) NPs showed spherical shapes of ∼200.5 nm diameter with uniform distributions.
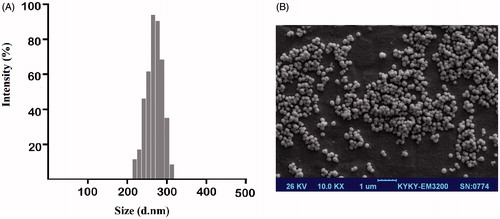
Table 2. Characterization of drug-loaded PLGA-PEG NPs.
Figure 2. FTIR spectra of single and dual drug-loaded NPs. FTIR spectrum analysis of three nano drug formulations including (A) Cur NPs and (B) Chr NPs (C) CurChr NPs were consistent with the structure of the supposed copolymer, and confirmed successful incorporation and interaction of Cur and Chr with PLGA/PEG NPs.
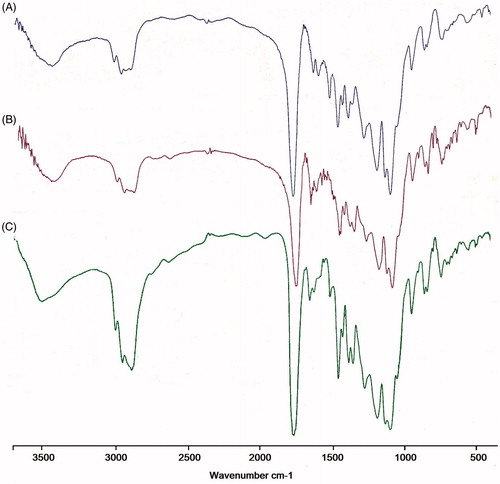
Figure 3. Drug release profiles of CurChr PLGA/PEG NPs. During the first 12 and 48 h, approximately, 20 and 54.5% of the initial dose of Cur was released from the polymeric matrix of the NPs, respectively. Both Cur and Chr can be released simultaneously with a slight initial rapid release followed by a relatively slower release phase. The data are presented as mean ± SD (n = 3).
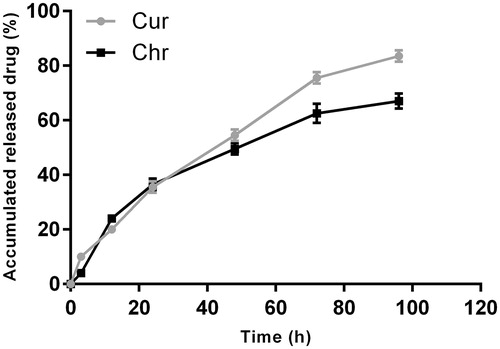
Figure 4. Cytotoxicity of different drug formulations on melanoma cell line in vitro. The growth of malignant B16F10 cell line was inhibited by different drug formulations, especially nondrugs. Accordingly, IC50s for nano Cur were 19.2 μM for 24 h and 11.6 μM for 48 h (A). IC50s of nano Chr were 52.6 μM for 24 h and 32.2 μM for 48 h (B). IC50s of CurChr NPs were 14.3 and 10.9 μM for 24 and 48 h, respectively (C). The cytotoxicity effects of PLGA-PEG on B16F10 proliferation were not significant (D). CurChr in mentioned concentrations displayed IC50s of 18.9 and 15.6 μM for 24 and 48 h, respectively (E). IC50s of pure Chr were 114.3 and 82.4 μM for 24 and 48 h, respectively (F). IC50s of pure Cur were 28.8 and 22.1 μM for 24 and 48 h, respectively (G).
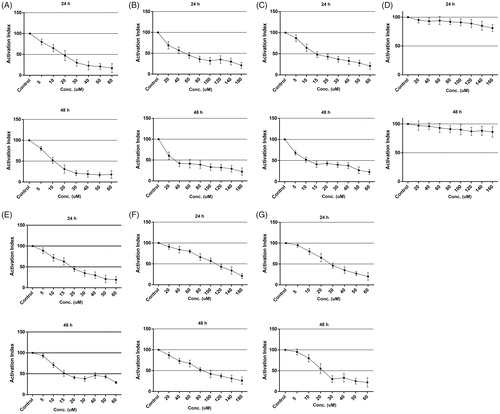
Figure 5. Effect of CurChr NPs on gene expression of MMPs in melanoma tumours in C57Bl6 mice. Effect of pure and nano formulated single and combination modalities of curcumin and chrysin on gene expression of (A) MMP-2 and (B) MMP-9 is shown. Compared to the negative control (C−), the expression of MMP-9 and MMP-2 genes were significantly decreased in all treated groups. This reduction had the highest amount in CurChr NPs group and then CurChr treated group for both genes. Also, the observed reduction was greater in nano groups compared to the pure groups. * and ** denotes p < .05 and p < .01, respectively.
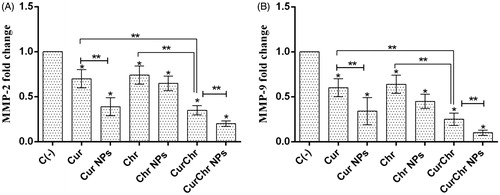
Figure 6. Effect of CurChr NPs on gene expression of TIMPs in melanoma tumours in C57Bl6 mice. Effect of pure and nano formulated single and combination modalities of curcumin and chrysin on gene expression of (A) TIMP-1 and (B) TIMP-2 is shown. Compared to the negative control (C−), the expression of TIMP-1 and TIMP-2 genes was significantly upregulated in all treated groups. Combination groups showed the highest amount of increase in expression of these two genes and the observed increase was greater in nano groups compared to the pure groups for both genes. * and ** denotes p < .05 and p < .01, respectively.
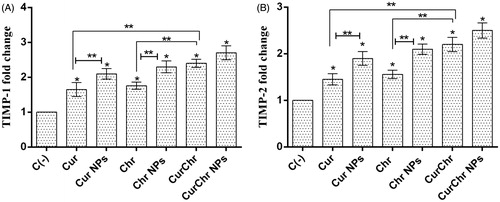
Figure 7. Effect of CurChr NPs on TERT gene expression in melanoma solid tumours in C57Bl6 mice. Compared to the negative control (C−), the expression of TERT was significantly decreased in all treated groups. This reduction had the highest amount in CurChr NPs group and then CurChr treated group. In addition, the observed reduction was greater in nano groups compared to the pure groups. * and ** denotes p < .05 and p < .01, respectively.
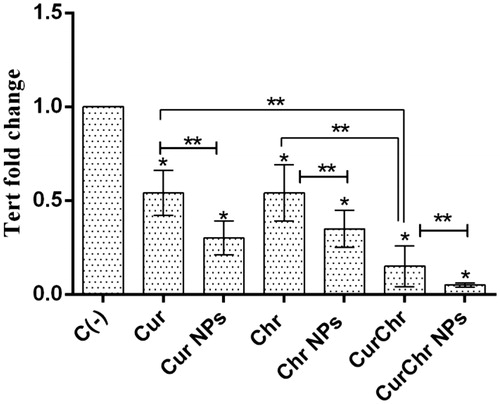
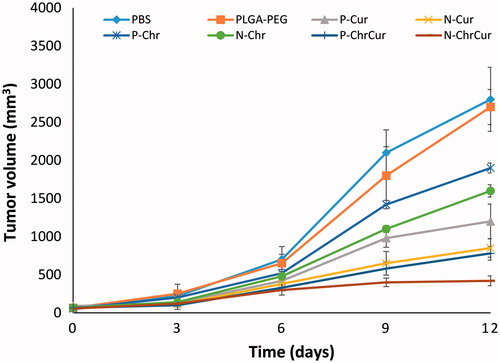
Figure 8. Therapeutic efficacy of CurChr NPs on growth of melanoma tumours in mice. While tumours in animals that were treated with saline and/or PLGA-PEG tend to grow progressively, there was a significant tumour growth inhibition by day 9 in therapeutic groups compared to saline as control. The highest melanoma tumour growth inhibition was detected for CurChr NPs, followed by CurChy = Cur NPs > Cur > Chr NP > Chr.