Figures & data
Figure 1. (a). Size of eight formulations which is characterized by Malvern zatasizer. (b) Poly dispersity index of eight formulations characterized by Malvern zetasizer. (c) Zeta potential of eight formulations which is characterized by Malvern zetasizer.
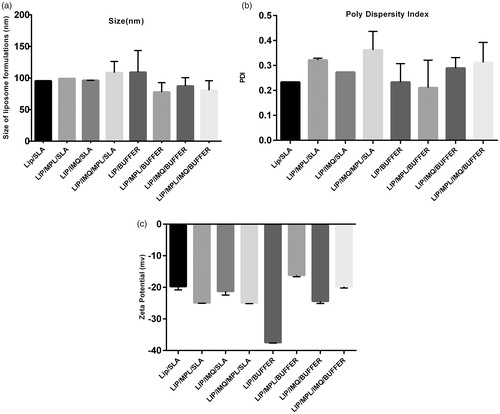
Table 1. Encapsulation efficiency of SLA and IMQ.
Figure 2. Footpad swelling in BALB/c mice immunized SC, three times in two week intervals with Buffer, SLA, empty Lip, Lip / SLA, Lip/MPL, Lip/IMQ, Lip/MPL/SLA, Lip/IMQ/SLA, Lip/MPL/IMQ/SLA, Lip/SLA + Lip/IMQ, Lip/SLA + Lip/MPL, Lip/SLA + Lip/MPL/IMQ, and Lip/MPL/IMQ after challenge with 106 L. major promastigotes in left hind footpads. The footpad thickness was measured weekly for 7 weeks. Each point represents the average increase in footpad thickness ± SEM (n = 6). *p < .05 when the immunized mice compared with mice received buffer. To estimate better the footpad swelling is shown in seven graph; (a) all thirteen groups are compared together (b) Lip/SLA group compared with control groups (c) Lip/MPL/SLA group compared with control groups (d) Lip/IMQ/SLA group compared with control groups (e) liposome containing IMQ groups compared with control groups (f) adjuvants/SLA groups compared with control groups and (g) SLA containing groups comparing together.
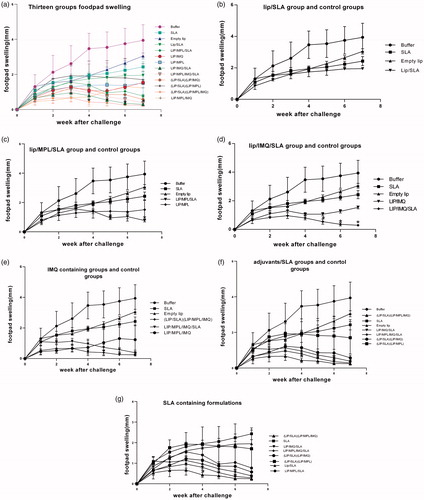
Figure 3. Foot and lymph node parasite burden in BALB/c mice immunized SC, three times in two week intervals with buffer, SLA, empty Lip, Lip / SLA, Lip/MPL, Lip/IMQ, Lip/MPL/SLA, Lip/IMQ/SLA Lip/MPL/IMQ/SLA, Lip/SLA + Lip/IMQ, Lip/SLA + Lip/MPL, Lip/SLA + Lip/MPL/IMQ, and Lip/MPL/IMQ after challenge with L. major promastigotes. A limiting dilution analysis was performed 7 weeks after challenge on the cells isolated from footpad and lymph node of individual mice and cultured in triplicate in eight serial dilutions. The number of viable parasite per tissue was determined by the following formula: −log10 (parasite dilution/tissue weight). The bar represent the average score ± SEM (n = 2). ****p < .0001, ***p < .001 when the immunized mice compared with mice received buffer. (a) Represents parasite burden in foot and (b) represents parasite burden in lymph node.
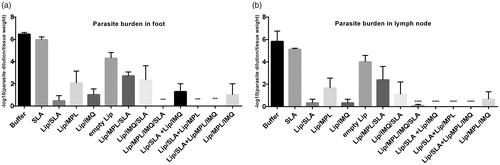
Figure 4. Cytokine levels in different groups of immunized mice at week 2 after the last booster injections. Mononuclear splenocytes were cultured in the presence of SLA (10 μg/ml) and the released IFN-γ (a) or IL4 (b) in the culture supernatants were detected using ELISA method results are shown as the mean ± SEM (n = 3). ****p < .0001, ***p < .001.
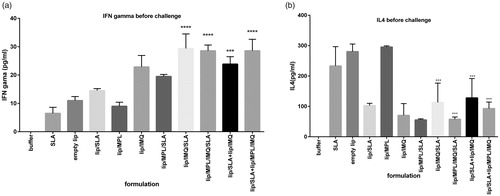
Figure 5. Cytokine levels in different groups of immunized mice 7 weeks after the challenge with L. major promastigotes. Mononuclear splenocytes were cultured in the presence of SLA (10 μg/ml) and the released IFN-γ (a) or IL4 (b) in the culture supernatants were detected using ELISA method. Results are shown as the mean ± SEM (n = 3). ****p < .0001.
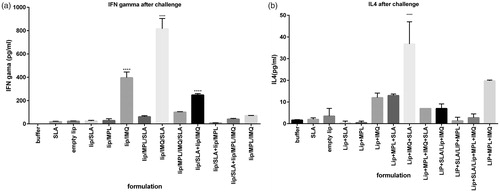
Table 2. IFN-γ/IL-4 Ratio as a marker of cell immunity activation calculated in all groups before the challenge with L. major promastigotes.
Table 3. IFN-γ/IL-4 Ratio as a marker of cell immunity activation calculated in all groups after the challenge with L. major promastigotes.
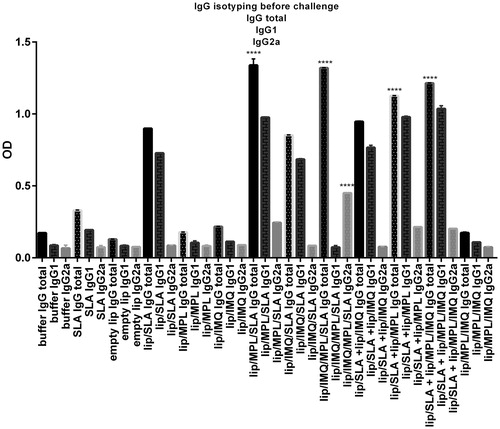
Figure 6. Levels of anti-SLA-specific total IgG,IgG1,IgG2a in pooled sera of different group of BALB/c mice immunized SC, three times in 2 week intervals, with buffer, SLA, empty Lip, Lip / SLA, Lip/MPL, Lip/IMQ, Lip/MPL/SLA, Lip/IMQ/SLA Lip/MPL/IMQ/SLA, Lip/SLA + Lip/IMQ, Lip/SLA + Lip/MPL, Lip/SLA + Lip/MPL/IMQ, and Lip/MPL/IMQ. Blood samples were collected from the mice 2 weeks after the last booster. The SLA-specific total IgG, IgG1 and IgG2a were assessed using ELISA method. The assays were performed in triplicate at 1/500 serum dilution which achieved after checkerboard planning. Values are the mean ± SD. ****p < .0001, ***p < .001 when the immunized mice compared with other groups.