Figures & data
Scheme 1. Schematic representation of airproof apparatus with temperature controller designed to determine the oxygen-release capacity. Uniformly, all the pumps and switches were illustrated. T is the temperature controller. P is the oxygen electrode. M is the magnetic rotor. Samples are measured as follows: (1) 0.9% NaCl is pumped into chamber A. Connect A with the aeration device providing N2 until PO2 lowed to 0 mmHg. (2) Solution of sample is pumped into chamber B. Connect B with the aeration device providing air until PO2 levelled off. (3) Solution in B is pumped into A and mix them by magnetic rotor. (4) PO2 in the mixture was recorded by the oxygen electrode P. The temperature controller T of the instrument maintained the reaction system at 37 ± 0.2 °C.
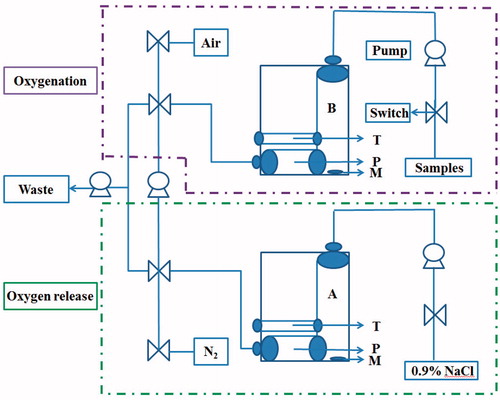
Figure 1. Characterizations of synthesized Hb-PDA nanoparticles with different preparation parameters. (a) Particle sizes using different mass ratios of DA/Hb from 1/10 to 1/2.5. (b) UV–vis absorption spectrum of synthesized nanoparticles with different mass ratios of DA/Hb. (c) Particle sizes with different pH value in 0.1 M PBS buffer. (d) Particle sizes in different types of buffers with the same pH (7.0).
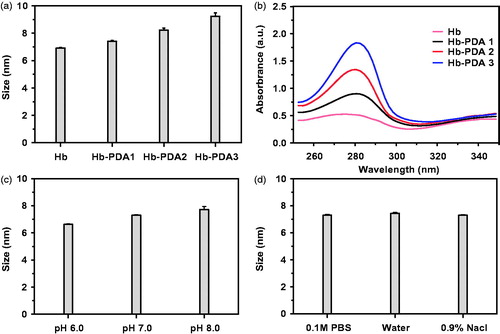
Figure 2. Influence of mass ratio and pH value on zeta potential of Hb-PDA nanoparticles. (a) Zeta potentials of Hb-PDA nanoparticles in neutral aqueous solution with different mass ratios of DA/Hb from 1/10 to 1/2.5. (b) Zeta potentials of Hb-PDA nanoparticles in solutions with the same ionic strength (150 mM) and different pH (6–8).
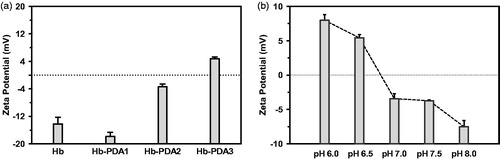
Figure 3. XPS analysis of DA, Hb and Hb-PDA nanoparticles. (a) General XPS survey of DA monomers, Hb and Hb-PDA nanoparticles. (b) Atomic composition of the C. (c) Atomic composition of the N and O. (d) N/O composition ratio. (e) De-convoluted high-resolution XPS spectrum of Fe for DA monomers, Hb and Hb-PDA nanoparticles. (f) Atomic composition of Fe for DA monomers, Hb and Hb-PDA nanoparticles.
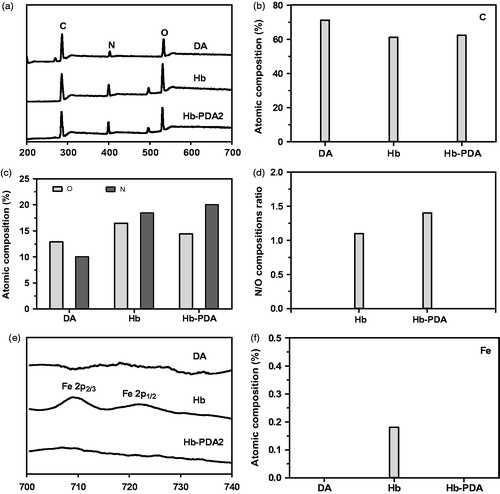
Figure 4. De-convoluted high-resolution XPS spectrum. De-convoluted high-resolution XPS spectrum of C 1s for (a) DA monomers, (b) Hb and (c) Hb-PDA nanoparticles. De-convoluted high-resolution XPS spectrum of O 1s for (d) DA monomers, (e) Hb and (f) Hb-PDA nanoparticles.
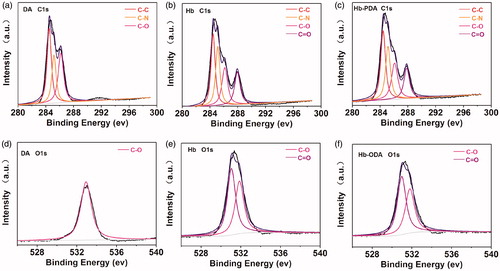
Figure 5. H2O2-induced changes in MetHb contents. The MetHb contents in the (a) Hb and (b) Hb-PDA solutions with different concentration before and after the treatment with 100 mM H2O2 for 30–90 min. The MetHb contents in the (c) Hb and (d) Hb-PDA solutions with different concentration after the incubation for 30 min with different concentration of H2O2. (e) The MetHb contents in 1.5% Hb and Hb-PDA solutions with different time after the addition of 100 mM H2O2. (f) The MetHb contents in 1.5% Hb and Hb-PDA solutions after the addition of H2O2 with different concentration for 30 min. The data are presented as the mean ± SD and *p < .05.
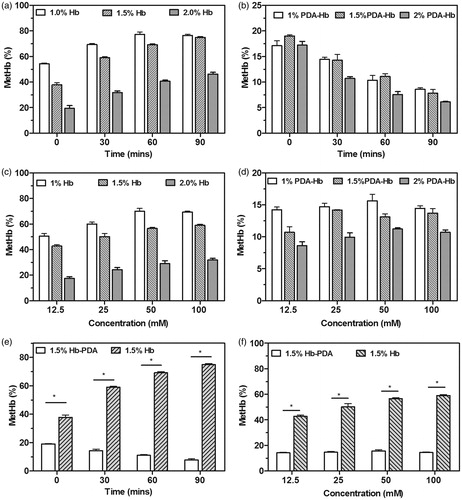
Figure 6. H2O2-induced change of mitochondrial membrane potential. (a) Mitochondrial membrane potential of non-damaged cells stained with JC-1. The change of mitochondrial membrane potential evaluated by the fluorescence intensity of JC-1 aggregate or JC-1 monomer in the H2O2-induced damaged THP-1 cells after (b) untreated and (c) treated with Hb-PDA nanoparticles. Intensity of fluorescent was conducted by flow cytometry and observed by confocal microscopy. Red fluorescence represents the J-aggregates.
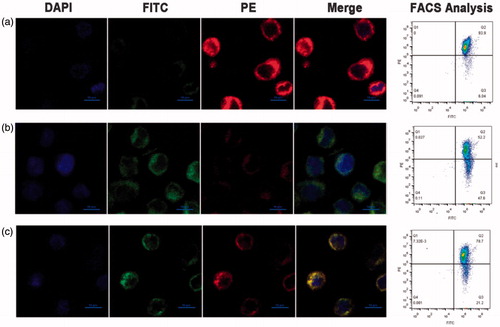
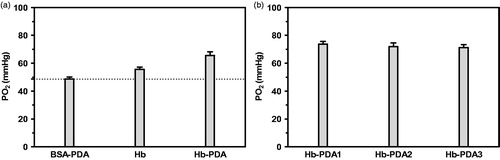
Figure 7. PO2 representing oxygen-release capacity. (a) PO2 after the addition of Hb, BSA-PDA and Hb-PDA nanoparticles in the same concentration into 0.9% NaCl solution. (b) PO2 after the addition of Hb-PDA1, Hb-PDA and Hb-PDA3 nanoparticles into 0.9% NaCl solution.