Figures & data
Figure 1. (A) The morphology of a PLGA/CNC nanofiber membrane and a PLGA/CNC/NT composite nanofiber membrane. (B) SEM micrographs of PLGA/CNC scaffolds and PLGA/CNC/NT scaffolds.
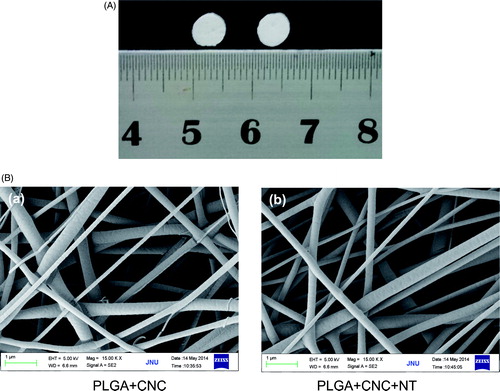
Figure 2. (A) Changes in the appearances of wounds dressed with PLGA/CNC scaffolds and PLGA/CNC/NT scaffolds after full-thickness wounds in diabetic mice. (B) Percentage of original wound area for the blank control group, PLGA/CNC and NT-loaded PLGA/CNC foam treatments in diabetic mice. The wound size was determined on Days 0, 2, 5, 7, 10 and 14 post-wounding. Results are presented as mean ± SD. #pb PLGA/CNC compared to blank control group, *pb <0.001 NT-loaded PLGA/CNC compared to blank control group, &pb PLGA/CNC compared to NT-loaded PLGA/CNC group.
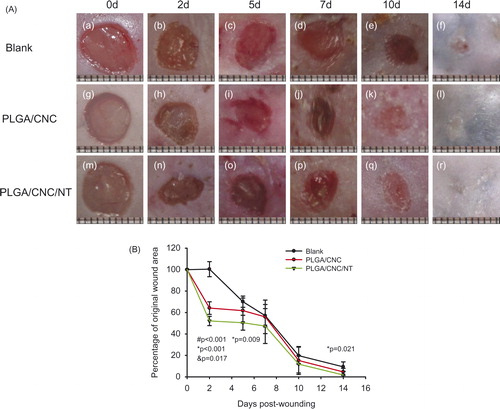
Figure 3. (A) Histological analyses of dorsal skin stained with H&E- staining after full-thickness wounds in diabetic mice. The bar corresponds to 100 μm. (B) The histological scores of the epidermal and dermal regeneration. Results are presented as mean ± SD. #pb PLGA/CNC compared to blank control group, *pb <0.001 NT-loaded PLGA/CNC compared to blank control group, &pb PLGA/CNC compared to NT-loaded PLGA/CNC group.
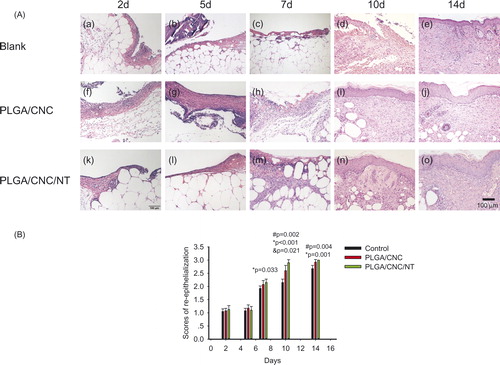
Figure 4. (A) Histological analyses of dorsal skin stained with Masson-trichrome staining after full-thickness wounds in diabetic mice. The bar corresponds to 100 μm. (B) The ratios of the fibrotic area to the whole area in diabetic wounds. Results are presented as mean ± SD. #pb PLGA/CNC compared to blank control group, *pb <0.001 NT-loaded PLGA/CNC compared to blank control group, &pb PLGA/CNC compared to NT-loaded PLGA/CNC group.
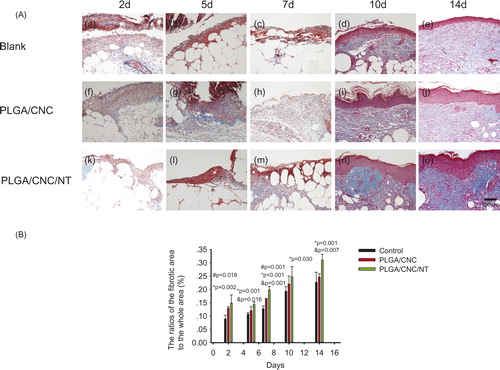
Figure 5. The expression of NT in dorsal skin after full-thickness wounds in diabetic mice. The bar corresponds to 50 μm.
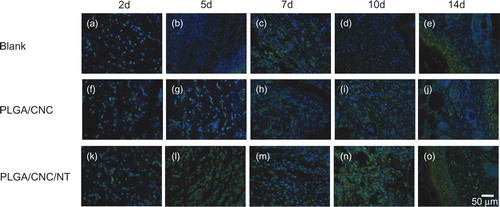
Figure 6. The expression of IL1β in dorsal skin after full-thickness wounds in diabetic mice. The bar corresponds to 100 μm.
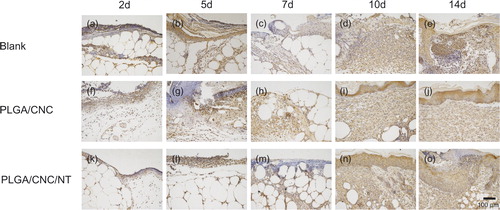
Figure 7. The expression of IL-6 in dorsal skin after full-thickness wounds in diabetic mice. The bar corresponds to 100 μm.
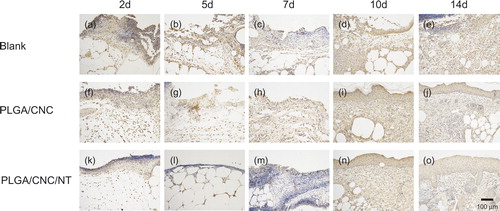
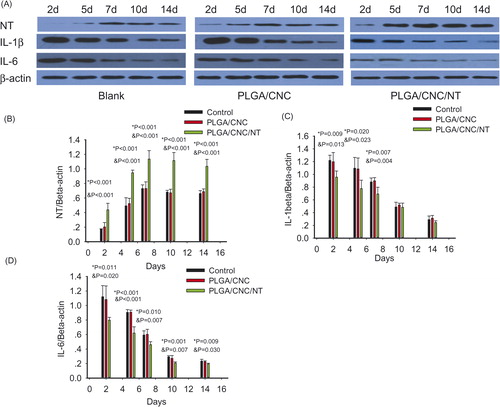
Figure 8. (A) The results of western blotting in diabetic wounds. (B–D) Showed the relative expression protein of NE, IL-1β and IL-6 in the wounds in diabetic mice. Protein expression levels were calculated relative to β-actin in the same sample. Values shown were means ± standard deviations, #pb PLGA/CNC compared to blank control group, *pb <0.001 NT-loaded PLGA/CNC compared to blank control group, &pb PLGA/CNC compared to NT-loaded PLGA/CNC group.