Figures & data
Figure 1. A bifunctional titanium alloy with a nano-hydroxyapatite coating (HBD + BMP/HA-Ti), which enables the simultaneously sustained release of the natural antimicrobial peptide human β-defensin 3 (HBD-3) and bone morphogenetic protein-2 (BMP-2). It shows combined antibacterial and osteogenic effects for potential application in clinical dental and bone therapy.
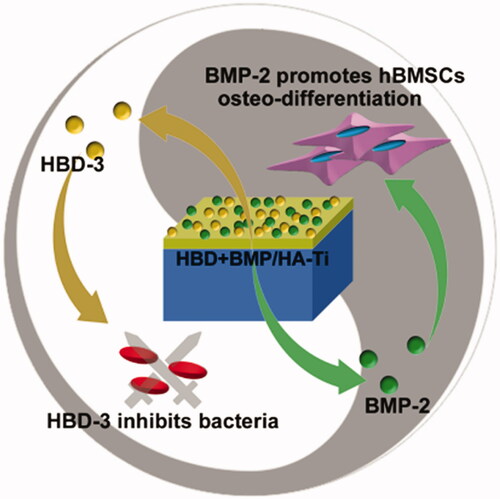
Figure 2. Preparation and structure of the bifunctional titanium alloy HBD + BMP/HA-Ti. (A) Schematic of the preparation procedure of HBD + BMP/HA-Ti. S1,S2: the Ti substrate was modified using preformed HA particles (HA) to form a poriferous nano-HA coating. S3: adsorption of antimicrobial HBD-3 and BMP-2. S4: slow combined release of HBD-3 and BMP-2; bifunctionality of HBD + BMP/HA-Ti, including antimicrobial activity and induction of osteogenic differentiation. (B) Appearance of the Ti, HA-Ti, and HBD + BMP/HA-Ti materials.
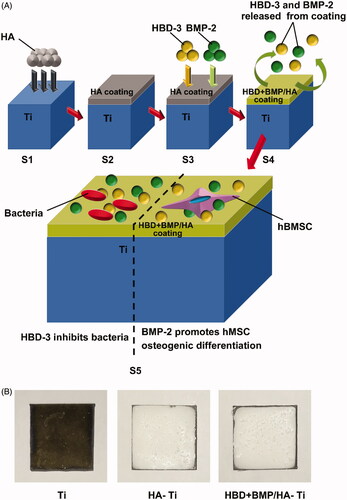
Table 1. The encapsulation efficiency (EE) of samples loaded with HBD-3 and BMP-2.
Figure 3. SEM micrographs and slow-release test. (A–D) SEM micrographs showing the poriferous HA coating of HBD + BMP/HA-Ti (B and C), a section with a thickness of 20–30 μm (D), and the smooth surface of Ti (B). (B) Cumulative release curve of HBD-3 and BMP-2.
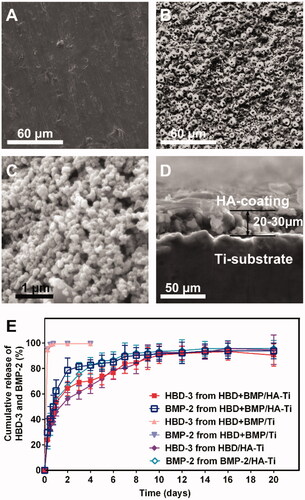
Figure 4. Test of the antibacterial properties of the coatings. (A) Comparison of the Ti specimens’ antibacterial capacity against suspensions of E. coli or S. aureus after culture for 1 and 7 days. (B) The optical density at 600 nm (O.D(0).600) of the bacterial suspensions. Each measurement was conducted with 3 parallel samples. ***p < .005.
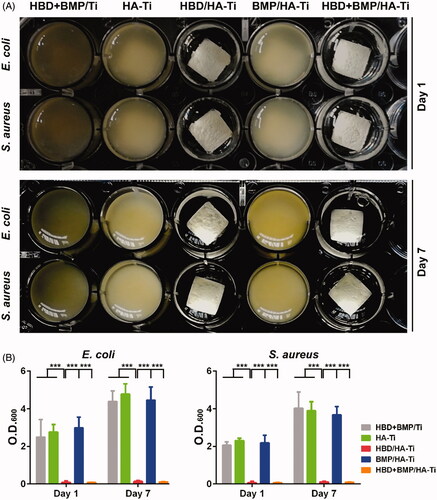
Figure 5. Determination of the viability of adherent bacteria on the Ti specimens. (A) CLSM image of bacteria grown on the Ti specimens immersed in the bacterial suspension after culture for 1 and 7 days. The amount and distribution of living (green) and dead (red) bacterial cells as determined using the Live/Dead BacLight Bacterial Viability Kit. (B) Quantification of living bacteria grown on the Ti specimens using FDA measurement at days 1 and 7. Each sample was measured in triplicate. *p < .05, **p < .01, ***p < .005. (C) SEM images of the bacterial grown on Ti specimens immersed in the bacterial suspension after culture for 7 days. The dead and damaged bacterial cells that were observed on HBD/HA-Ti and HBD + BMP/HA-Ti are indicated with red arrows.
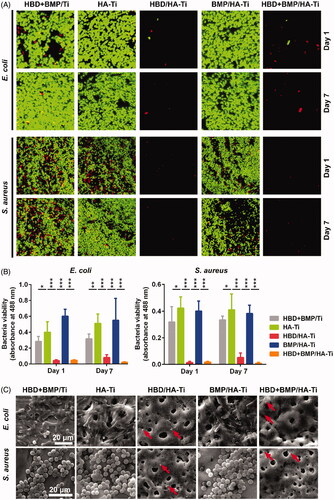
Figure 6. Cell proliferation of hBMSCs grown on the Ti specimens. (A) CLSM images of hBMSCs grown on Ti specimens at day 7. (B) Quantification of the hBMSCs growing on the Ti specimens by CCK-8 measurements at days 1, 4, and 7. Each measurement contained 6 parallel samples. n.s. = no significant difference, *p < .05. (C) SEM images of hBMSCs growing on Ti specimens at day 7.
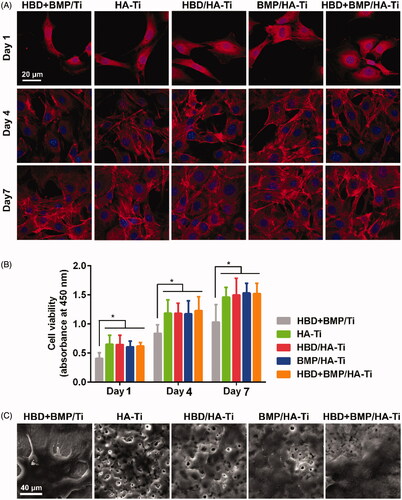
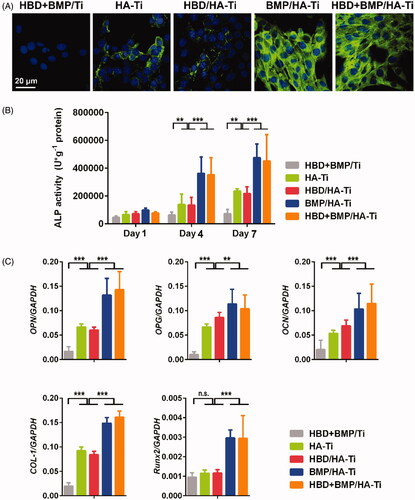
Figure 7. Osteoinductive differentiation of hBMSCs grown on the Ti specimens. (A) CLSM images showing the expression of COL-1 by the hBMSCs grown on the Ti specimens at day 7. (B) ALP activity of hBMSCs grown on the Ti specimens at days 1, 4, and 7. (C) Quantitative PCR analysis of the expression of osteogenic gene markers in hBMSCs cultured on Ti specimens at day 1. The y-axis represents the relative expression (2-ΔCT) normalized to the expression level of the housekeeping gene GAPDH. Each measurement was done on 3 samples. n.s. = no significant difference, **p < .01, ***p < .005.