Figures & data
Figure 1. Hb–HSA3 cluster. Illustration of molecular structure of Hb–HSA3 in which an Hb is wrapped covalently with HSAs, and homogeneous solution of Hb–HSA3 (20 g/dL) in PBS (pH 7.4).
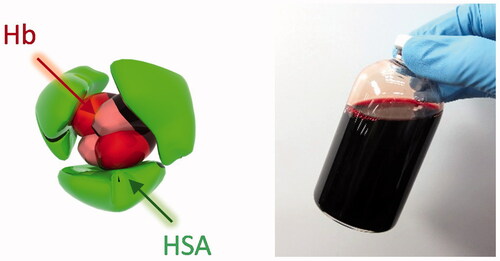
Figure 2. Compatibility with human blood. (A) Blood cell (RBC, WBC, PLT) numbers in human blood/Hb–HSA3 mixture suspension ([Hb–HSA3] = 10, 20 and 40 vol%). Basal values (BVs) were 457 ± 12 × 104 cells/μL in the RBC group, 43 ± 4 × 10² cells/μL in the WBC group and 24 ± 1 × 10⁴ cells/μL in the PLT group. Each datum represents mean ± SEM (n = 3). (B) Blood cell (RBC, WBC, PLT) numbers in human blood/HSA mixture suspension ([HSA] = 10, 20 and 40 vol%). Basal values (BVs) were 458 ± 11 × 104 cells/μL in the RBC group, 43 ± 4 × 10² cells/μL in the WBC group and 24 ± 1 × 10⁴ cells/μL in the PLT group. Each datum represents mean ± SEM (n = 3). (C) PT values of human blood samples after mixing with Hb–HSA3, HSA and PBS solution (10, 20 and 40 vol%). Each datum represents mean ± SEM (n = 3).
![Figure 2. Compatibility with human blood. (A) Blood cell (RBC, WBC, PLT) numbers in human blood/Hb–HSA3 mixture suspension ([Hb–HSA3] = 10, 20 and 40 vol%). Basal values (BVs) were 457 ± 12 × 104 cells/μL in the RBC group, 43 ± 4 × 10² cells/μL in the WBC group and 24 ± 1 × 10⁴ cells/μL in the PLT group. Each datum represents mean ± SEM (n = 3). (B) Blood cell (RBC, WBC, PLT) numbers in human blood/HSA mixture suspension ([HSA] = 10, 20 and 40 vol%). Basal values (BVs) were 458 ± 11 × 104 cells/μL in the RBC group, 43 ± 4 × 10² cells/μL in the WBC group and 24 ± 1 × 10⁴ cells/μL in the PLT group. Each datum represents mean ± SEM (n = 3). (C) PT values of human blood samples after mixing with Hb–HSA3, HSA and PBS solution (10, 20 and 40 vol%). Each datum represents mean ± SEM (n = 3).](/cms/asset/0ecd00ed-426e-410b-ab77-9177280f9009/ianb_a_1505740_f0002_c.jpg)
Figure 3. Changes of circulation parameters. Time courses of circulation parameters of anesthetized rats after 20% exchange transfusion with Hb–HSA3 and HSA solution: (A) Hct, (B) MAP, (C) HR (basal values (BVs) are 218 ± 2 beats/min in Hb–HSA3 group, 315 ± 44 beats/min in HSA group and 332 ± 45 beats/min in sham group) and (D) RESP. Each datum represents mean ± SEM (n = 3). *p < .05 vs. sham group, **p < .01 vs. sham group.
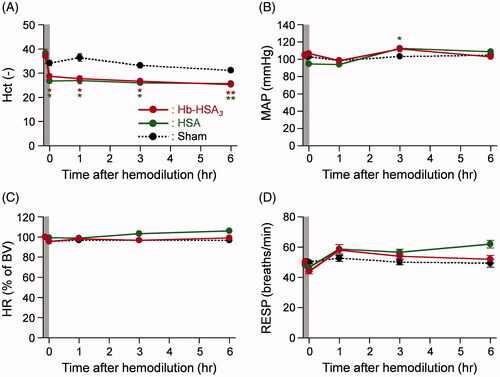
Figure 4. Changes of blood gas parameters. Time courses of blood gas parameters of anesthetized rats after 20% exchange transfusion with Hb–HSA3 and HSA solution: (A) PaO2, (B) PvO2, (C) PaCO2 and (d) pH. Each datum represents mean ± SEM (n = 3). *p < .05 vs. sham group.
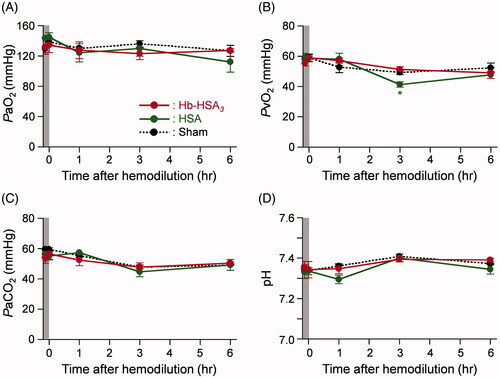
Figure 5. Serum biochemical tests. Serum biochemical tests of anesthetized rats after 6 h from 20% exchange transfusion with Hb–HSA3 and HSA solution. Each datum represents mean ± SEM (n = 3): gray bar, sham group without infusion; green bar, HSA group; red bar, Hb–HSA3 group. *p < .05 vs. sham group, **p < .01 vs. sham group.
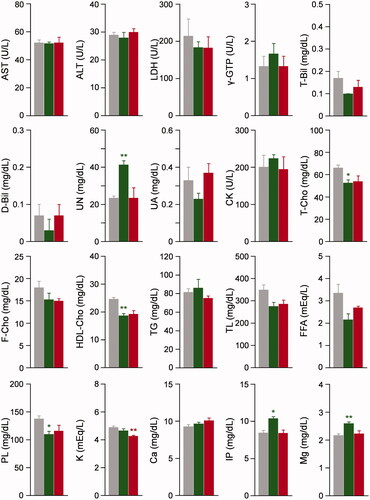
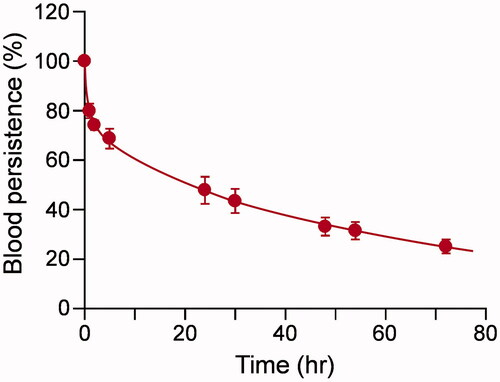
Figure 6. Circulation lifetime. Relative plasma concentration of Hb–HSA3(Cy5.5) in dogs after intravenous administration. Each datum represents mean ± SEM (n = 5).