Figures & data
Figure 1. UV-visible spectra of aqueous leaf extract and three concentrations (0.1, 0.01, and 0.001 M) of FeCl2.4H2O which were added to leaf extract (a) and increasing pattern of absorbance at 250 nm under selected salt concentration (0.1 M) of FeCl2.4H2O at various temperatures (b).
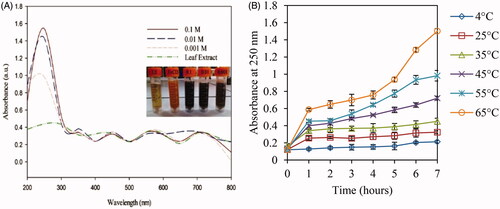
Figure 2. XRD patterns of leaf extract A. haussknechtii (a) and green synthesized Fe3O4 NPs (b).
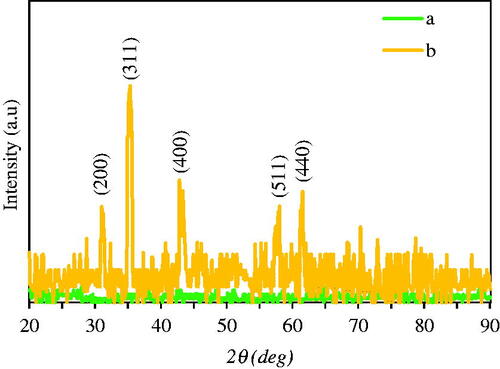
Figure 3. FT-IR spectrum peaks of leaf extract (a) and Fe3O4 NPs (b) biosynthesized by A. haussknechtii.
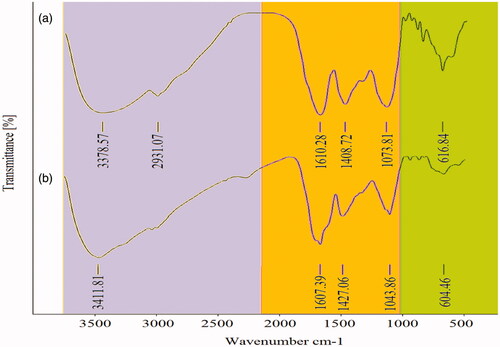
Figure 4. SEM photographs (a) and size distribution histogram (b) of biosynthesized Fe3O4 NPs with stages (1, 2, 3, and 4) of branched NPs formation. Amounts of each elements (c) and elemental distribution (d) in phytosynthesis of Fe3O4 NPs were illustrated by EDAX analysis.
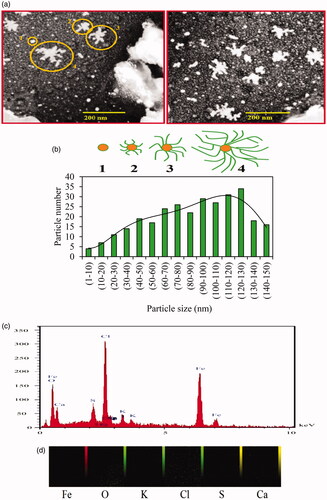
Figure 5. AFM micrographs (a, b, c, e, and f) and 3 D AFM images (d) of biosynthesized Fe3O4 NPs.
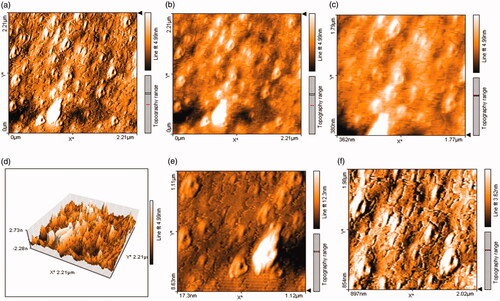
Figure 6. Standard curve of absorbance against gallic acid concentration y = 0.0087x + 0.0071; R2=0.9987 (a), rutin concentration y = 0.0042x; R2 = 0.9652 (b), and (+)-catechin concentration y = 0.0055x + 0.004; R2= 0.967(c).
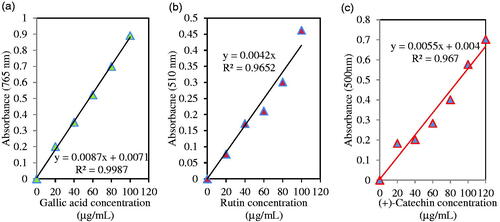
Table 1. Total contents of phenolics, flavonoid, flavonol, tannin, and ratio of flavonoid/phenol for phytofabricated Fe3O4 NPs and plant extract.
Figure 7. TAC (a) and DPPH free radical scavenging activity (b) of leaf extract and Fe3O4 NPs. Ascorbic acid solution was applied as standard.
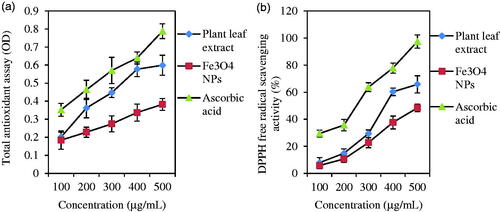
Figure 8. Images showing zone inhibition values of different concentrations of FeCl2.4H2O (0.1, 0.01 and 0.001 M) against three bacteria strains: E. coil ATCC 25922 (a), S. aureus ATCC 43300 (b), and S. marcescens ATCC13880 (c).
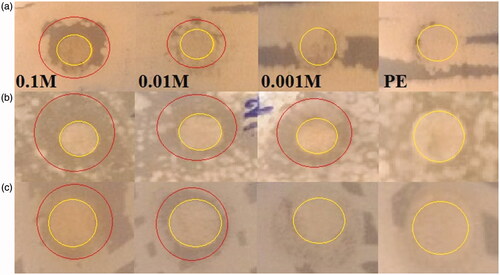
Table 2. IZD Results for Fe3O4 NPs effects on E. coil, S. aureus, and S. marcescens.
Figure 9. Results of MIC/MBC assays for pathogenic bacteria under treatment of Fe3O4 NPs.
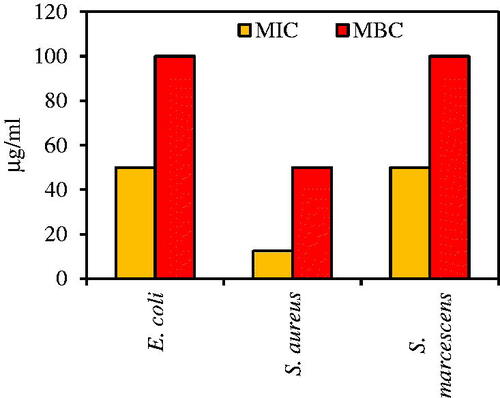
Figure 10. Effect of Fe3O4 NPs on bacterial growth kinetic of E. coli ATCC 25922, S. marcescens ATCC13880, and S. aureus ATCC 43300 (with initial OD of 0.1 and 0.2) at different time. Error bars represent standard errors of the mean (based on tree independent replicates).
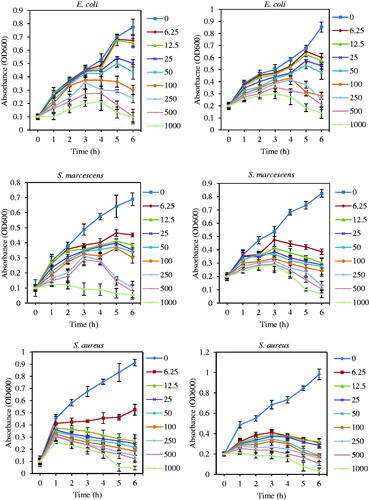
Figure 11. Specific growth rate, μ, (OD600nm/h) of three multidrug resistance bacteria: (a) E. coli ATCC 25922, (b) S. marcescens ATCC13880, and (c) S. aureus ATCC 43300 in the presence of MIC concentrations (50 μg/mL for E. coli and S. marcescens and 12.5 μg/mL for S. aureus) and absence of Fe3O4 NPs (control).
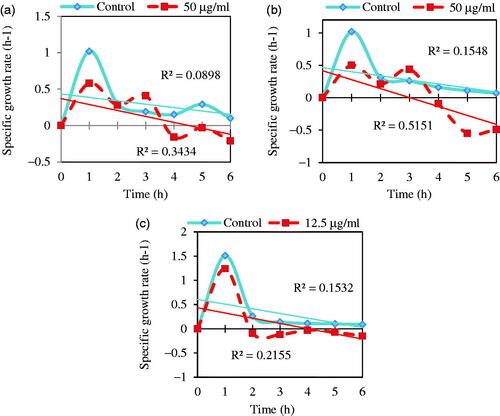
Figure 12. SEM images of Fe3O4 NPs treated S. aureus cell surface. (a) cell wall clumping, (b) NPs on the cell surface, (c) bacterial rupture and (d) schematic design of antibacterial mechanisms of Fe3O4 NPs against S. aureus.
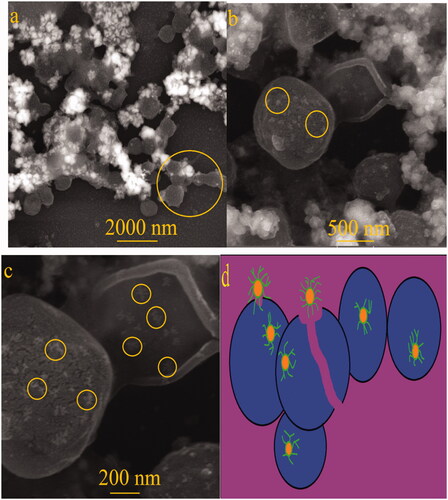
Figure 13. The graphic representation of biofilm formation of E. coli, S. aureus, and S. marcescens under treatment of different concentrations of green synthesized Fe3O4 NPs (0, 3.12, 6.25, 12.5, 25, 50, and 100 μg/mL) after 24 h incubation at 37 °C without shaking. Data are presented as average ± SD and (*) sign is p ≤ .05 value versus control samples.
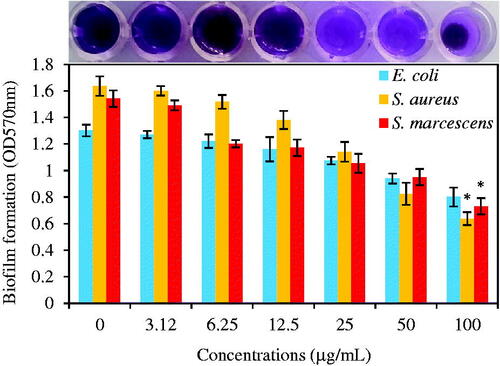
Figure 14. Light microscopic images (at a magnification of 40×) of antibiofilm activity of Fe3O4 NPs in various concentrations 0 (a), 3.12 (b), 6.25 (c), 12.5 (d), 25 (e), 50 (f), 100 μg/mL (g) and comparison of biofilm area between control and NPs concentration by 100 μg/mL.
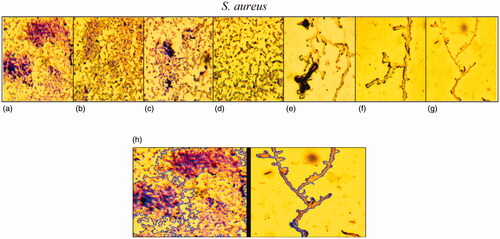
Figure 15. Topography images in 2-D and (a, b, d, and e) in 3-D (c and f) illustrate higher roughness in control sample than treatment (d, e, and f) having disrupted structure of biofilm having pores. Photographs were taken at a resolution of 4.42 × 4.42 μm. Values of biofilm roughness for untreated S. aureus ATCC 43300 as control and treated by Fe3O4 NPs as treatment (g).
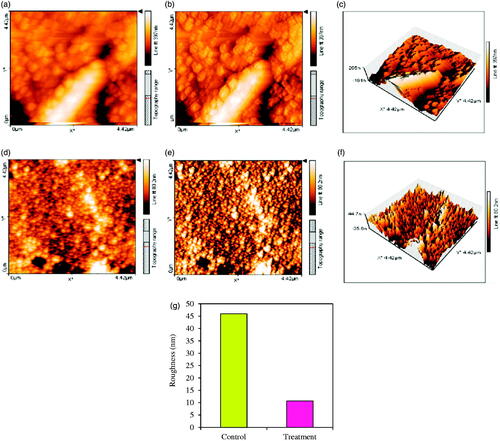
Figure 16. FT-IR spectra of biofilm formation by S. aureus ATCC 43300 under Fe3O4 NPs stress (a) and without NPs as control (b).
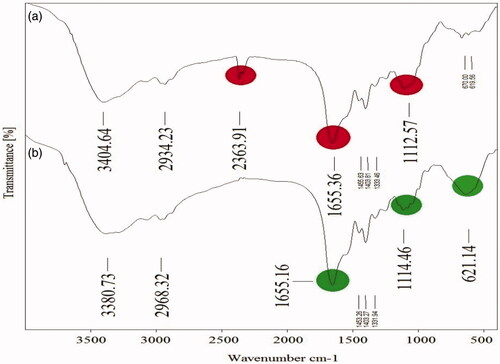
Figure 17. Decreasing pattern of spreading in S. aureus ATCC 43300 colony at presence of 0 (a), 3.12 (b), 6.25 (c), 12.5 (d), 25 (e), 50 (f), and 100 μg/mL (g) of biosynthesized Fe3O4 NPs.
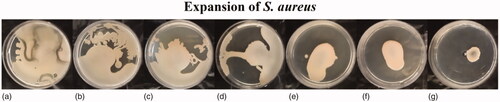
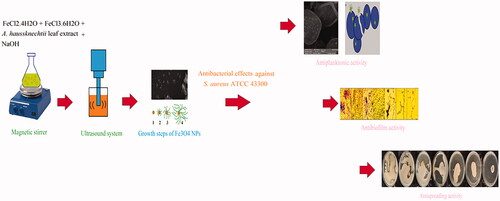
Figure 18. Schematic image for several selection of this study.