
Figures & data
Figure 1. Micrograph of the size and size distribution of the PEGylated liposomal nanoparticles containing drug obtained from the zetasizer.
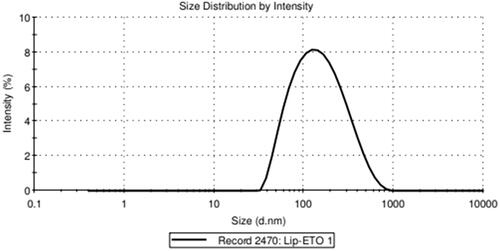
Figure 2. SEM microscope images of PEGylated liposomal nanoparticles containing etoposide in various magnifications: (a) 100 nm, (b) 200 nm, and (c) 500 nm.
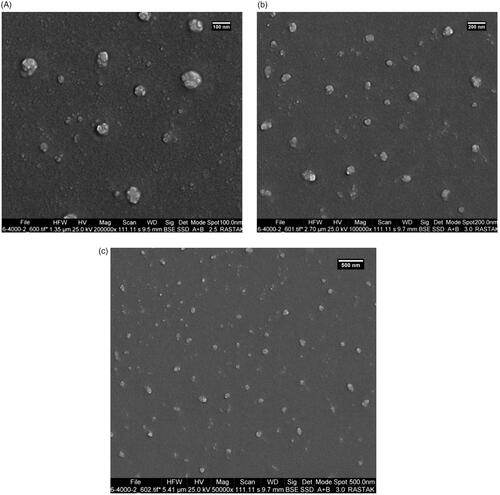
Table 1. Parameters of the calibration curve for etoposide.
Figure 3. The standard curve for etoposide.
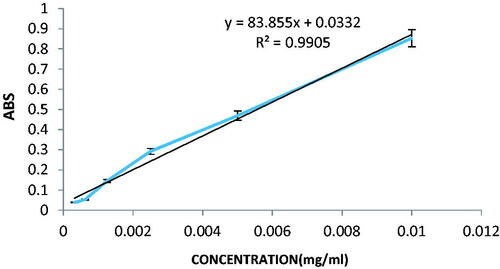
Figure 4. In vitro release formulation of free drug and PEGylated liposomal drug in the PBS (pH 7.4), at 37 °C (n = 3) and at determined times.
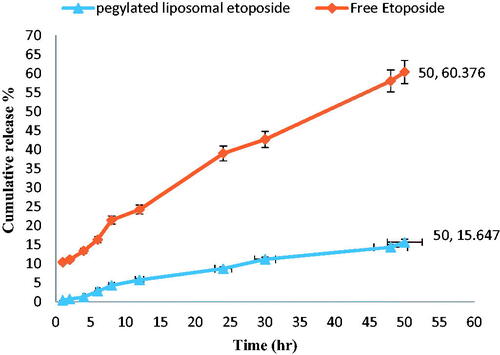
Figure 5. Cell viability of PEGylated nanoliposomal and free etoposide in the cell line A-549 during two time incubation. (a) After 24-h incubation and (b) After 48-h incubation.
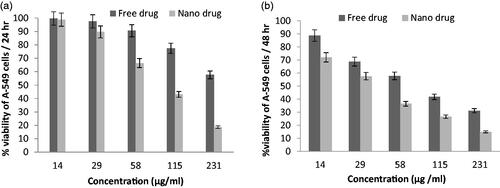
Figure 6. Cell viability of PEGylated nanoliposomal and free etoposide in The Calu6 cell line during two time incubation. (a) After 24-h incubation and (b) After 48-h incubation.
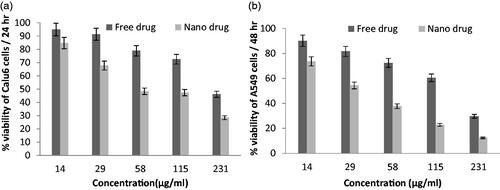
Figure 7. The values IC50 (μg/ml) for this free etoposide and PEGylated liposomal drug in various cell lines over 24-h, 48-h and 72-h incubation at 37 °C under 5% CO2. (a) A-549 cell line and (b) Calu6 cell line.
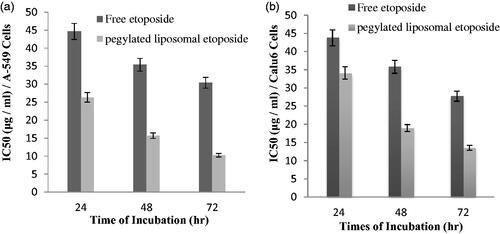
Figure 8. Flow cytometric analysis to study the effect of nanoliposomes to induce apoptosis in A-549 and Calu6 cells. (a) Dot plot of A-549 and Calu6 cells treated by PBS for 48 h (control), (b) dot plot of A-549 and Calu6 cells treated by PEGylated liposomal etoposide.
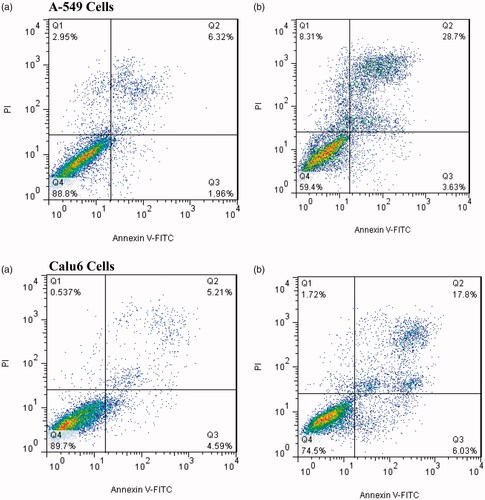
Table 2. The percentage of induction of apoptosis in cells treated with the nano drug in comparison with the control group and 48 h of incubation.