Figures & data
Table 1. List of primers sequences used in this study.
Figure 1. Characterisation of GNP-CK-CopA3. (A) UV–vis absorption spectra, (B) TEM image, (C) HRTEM image, (D and E) Elemental mapping, (F) XRD pattern, (G) SAED pattern, (H) EDX spectrum, and (I) PL of the prepared nanoparticles. FTIR spectra of (J) GNP-CK-CopA3, (K) ginsenoside CK, (L) gold salt, and (M) a tabular view of the functional group profile.
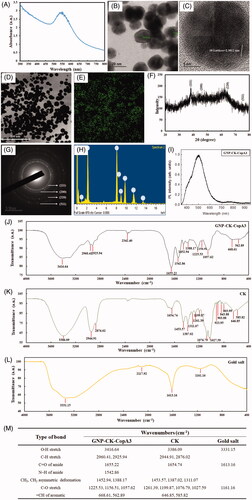
Figure 2. Cellular uptake and localisation of GNP-CK-CopA3. (A) EDF images of RAW264.7 cells after incubation with 40 μg/mL GNP-CK-CopA3 for 3 h. (B) TEM images of RAW264.7 cells after 2 h treatment of 20 and 40 µg/mL GNP-CK-CopA3. (C) Staining analysis for detection of the lysosome (green) and nucleus (blue) in RAW264.7 cells by Lyso-Tracker and Hoechst 33258 staining. All treatments were performed three times (n = 3).
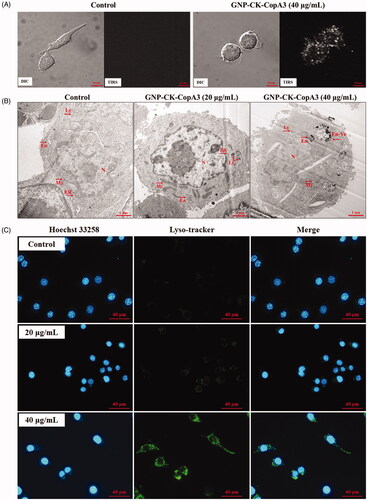
Figure 3. Effect of GNP-CK-CopA3 on cell viability and NO and intracellular ROS production in LPS-stimulated RAW264.7 cells. Cell viability of (A) NHDFs, (B) HaCaTs, and (C) Cells incubation with different concentrations of GNP-CK-CopA3 for 24 h was determined by MTT assay. (D) NO production induced by 1 μg/mL LPS with or without GNP-CK-CopA3 was assessed in RAW264.7 cells. (E) Cells were stained with cellular ROS/Superoxide Detection Assay Kit and observed in fluorescence microscopy with 200× magnification. (F) Statistical analysis of the mean fluorescence intensity of ROS staining. Data are presented as mean ± SEM. *p < .05 and **p < .01 vs. normal control group; #p < .05 and ##p < .01 vs. LPS-treated group. All treatments were performed three times (n = 3).
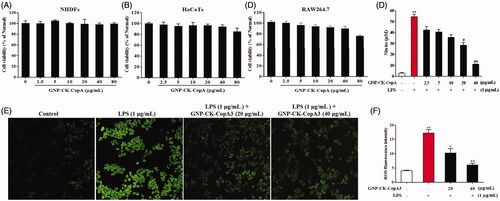
Figure 4. Effect of GNP-CK-CopA3 on pro-inflammatory cytokines iNOs, COX-2, TNF-α, IL-1β, and IL-6 expression in LPS-induced RAW264.7 cells. (A) The mRNA expression was quantified by RT-PCR. (B) The protein expression was determined by Western blotting. The densitometric quantification was done by ImageJ software. GAPDH and β-actin were used as internal control for RT-PCR and Western blotting, respectively. Data are presented as mean ± SEM. *p < 0.05 and **p < 0.01 vs. normal control group; #p < 0.05 vs. LPS-treated group. All treatments were performed three times (n = 3).
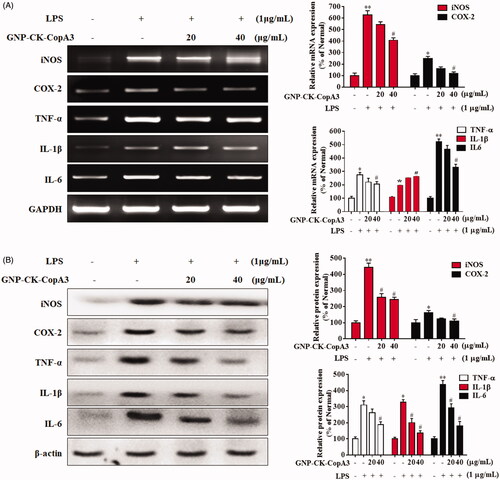
Figure 5. Effect of GNP-CK-CopA3 on LPS-induced NF-κB activation. (A) RAW264.7 cells were treated with GNP-CK-CopA3 for 1 h prior to LPS (1 μg/mL) for 4 h. The protein expression of p-IκBα, IκBα in the cytoplasm and NF-κB p65 in the nucleus were determined by Western blotting. The relative density of (B) p-IκBα, (C) IκBα, (D) NF-κB p65 and (E) Histone. (F) NF-kB nuclear translocation was assessed by immunofluorescence staining for NF-kB p65 antibody (green) and the nuclei were detected by Hoechst (blue). The p65 nuclei-positively stained cells were quantified as the percentage of control group. Densitometric analysis was done by ImageJ software. Data are presented as mean ± SEM. *p < .05 and **p < .01 vs. normal control group; #p < .05 vs. LPS-treated group. All treatments were performed three times (n = 3).
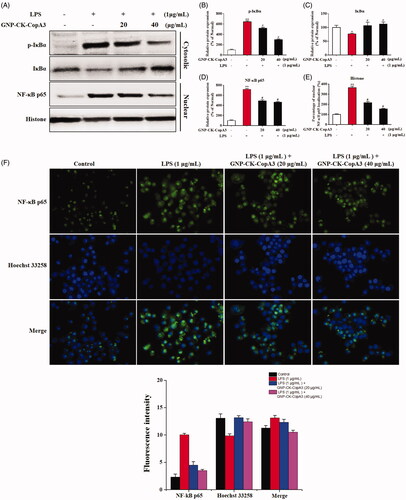
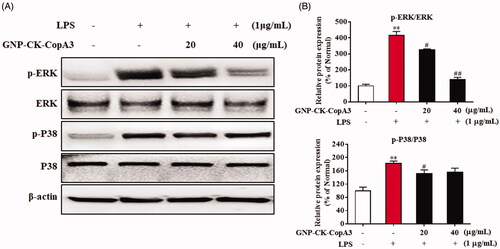
Figure 6. Effect of GNP-CK-CopA3 on LPS-induced MAPK activation. (A) After the treatment of LPS (1 μg/mL) for 2 h with or without GNP-CK-CopA3, the protein expression levels of p-ERK and p-p38 were measured by Western blotting. (B) Densitometric analysis was done by ImageJ software. Data are presented as mean ± SEM. **p < .01 vs. normal control group; #p < .05 and ##p < .01 vs. LPS-treated group. All treatments were performed three times (n = 3).