Figures & data
Table 1. Formulation composition and characteristics of investigated KA-NLC dispersion (% w/w).
Figure 1. TEM micrographs of KA-NLC3 dispersion.
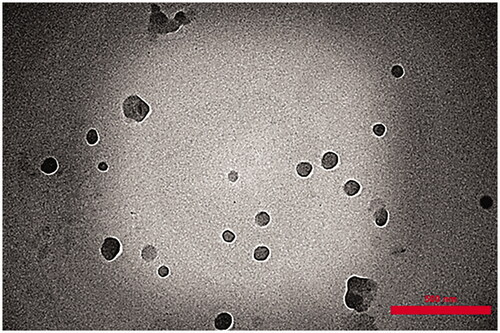
Figure 2. The ATR-FTIR spectra of KA, Chol, GMS, OA, physical mixture, and KA-NLC3 dispersion.
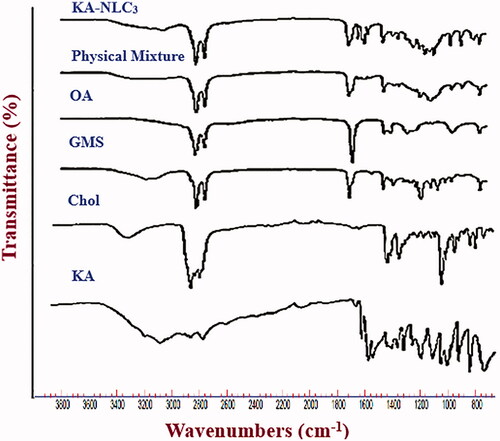
Figure 3. DSC thermograms obtained for KA, Chol, GMS, physical mixtures, and KA-NLC3 dispersion.
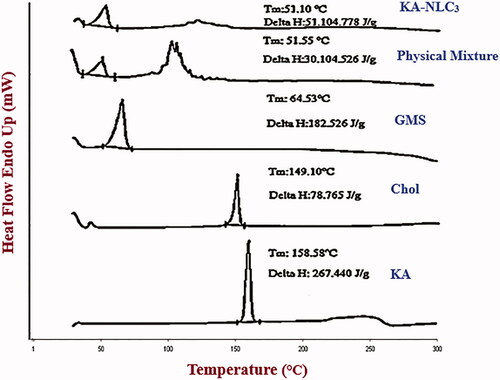
Figure 4. XRD of KA, Chol, GMS, physical mixtures, and KA-NLC3 dispersion.
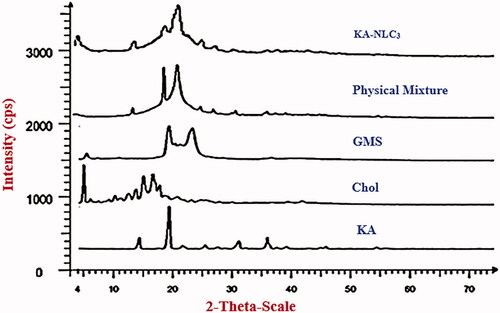
Figure 5. Dissolution profile of KA solution and KA-NLC3 dispersion.
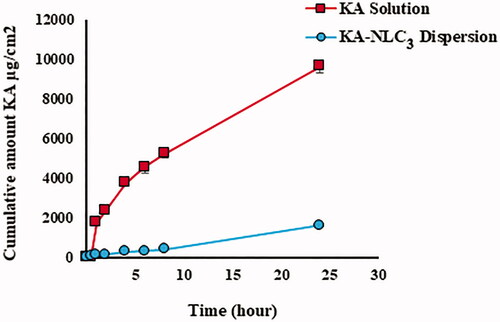
Figure 6. Curves of tyrosinase mushroom activity of KA solution and KA-NLC3 dispersion. (A) The concentrations of KA were 100, 50, 25, 10, 5 µg/ml and (B) the concentrations of KA-NLC3 dispersion were 10, 5, 2.5, 2,1, 0.5, and 0.25 µg/ml. IC50 values were calculated by nonlinear regression using Graph Pad Prism 5.0.
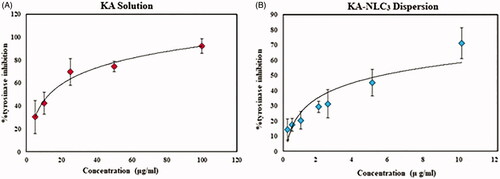
Figure 7. Ex vivo and in vitro permeation profiles of KA-NLC3 dispersion and KA solution across human, rat and synthetic skins. Data are presented as mean and standard deviation of three determinations (n = 3).
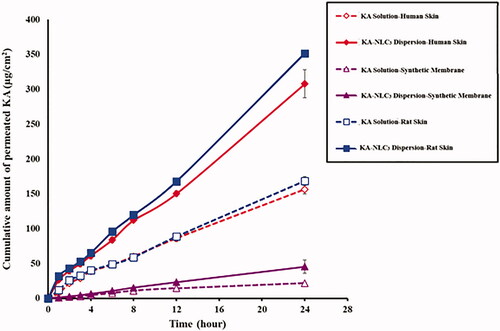
Figure 8. Cumulative amount of KA in the membrane layers, including rat skin, HEM and synthetic membrane.
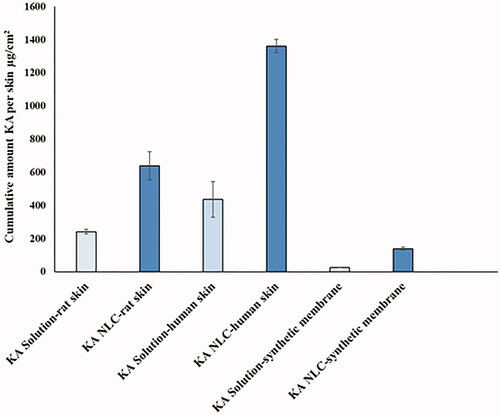
Table 2. Stability information of the KA-NLC3 dispersion after 3 months of storage.
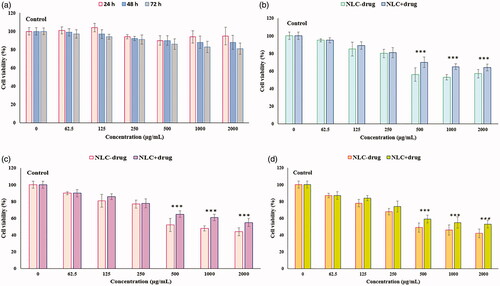
Figure 9. Viability of normal human skin fibroblast cells (HFF-1) (MTT assay) after 24, 48, and 72 h exposure to (a) KA solution for 24, 48, and 72 h, (b) NLC-drug (KA) and NLC + drug (KA) for 24 h, (c) NLC-drug (KA) and NLC + drug (KA) for 48 h, (d) NLC-drug (KA) and NLC + drug (KA) for 72 h. Data represented as the means ± SD of eight identical experiments. ***p<.001 expression in the formulations treated cells versus the untreated cells.