
Figures & data
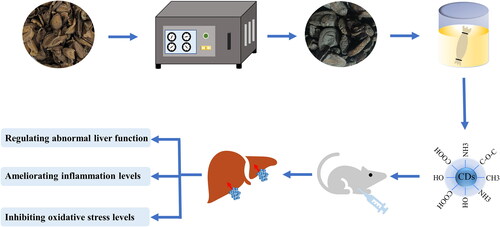
Figure 1. Flow chart of the preparation process of Curcumae Radix carbonsata carbon dots (CRC-CDs) prepared.
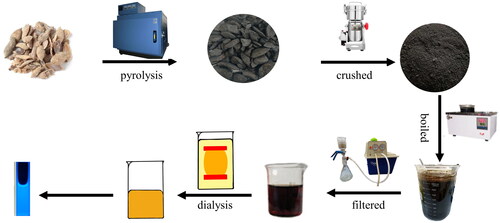
Figure 2. Morphological characterisations of CRC-CDs. (A) Transmission electron microscopy (TEM) images of CRC-CDs displaying ultra-small particles. (B) Particle size distribution histogram of CRC-CDs. (C) High-resolution TEM image of CRC-CDs and lattice spacing of CRC-CDs (in the Middle). (D) X-ray diffraction pattern (E) Ultraviolet-visible spectrum. (F) Fluorescence spectra. (G) Fluorescence spectra of FP-CDs with different excitation wavelengths. (H) Fourier transform infra-red spectrum.
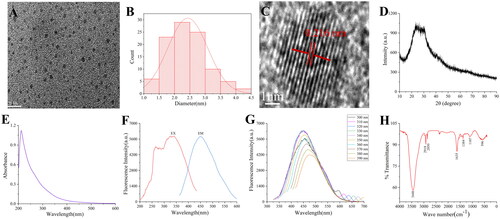
Figure 3. X-ray photoelectron spectroscopy (XPS) spectrum of CRC-CDs. (A) The full survey spectrum. High-resolution survey spectra of (B) C 1s, (C) O 1s and (D) N 1s.
Figure 4. Effects of different concentrations of CRC-CDs on the cell viability of RAW264.7.
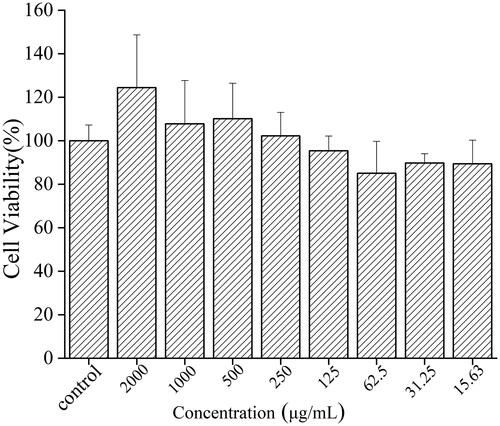
Figure 5. Effects of CRC-CDs on weight changes in mice with carbon tetrachloride-induced liver fibrosis. Mice were assigned into seven groups, namely normal control group (NC), CCl4 group (CCl4), silybin + CCl4 group (silybin + CCl4), high dose of CRC-CDs + CCl4 group (CRC-CDs-H + CCl4, 9.33 mg/kg), medium dose of CRC-CDs + CCl4 group (CRC-CDs-M + CCl4, 4.67 mg/kg), low dose of CRC-CDs + CCl4 group (CRC-CDs-L + CCl4, 2.34 mg/kg) and high dose of CRC-CDs group (CRC-CDs-H, 9.33 mg/kg). data were expressed as means ± standard deviation. ##p < 0.01 vs. normal control group, *p < 0.05 and **p < 0.01 vs. CCl4 group.
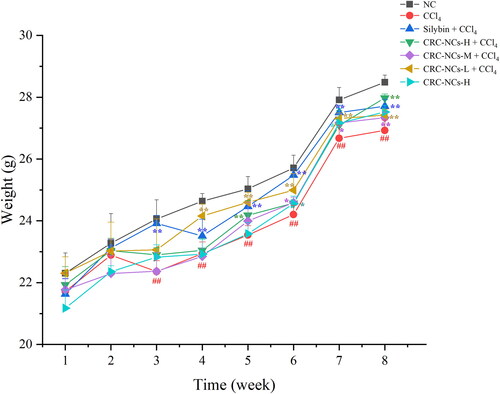
Figure 6. Effects of CRC-CDs on liver weight (A) and liver index (B) in mice with carbon tetrachloride-induced liver fibrosis. Mice were assigned into seven groups, namely normal control group (NC), CCl4 group (CCl4), silybin + CCl4 group (silybin + CCl4), high dose of CRC-CDs + CCl4 group (CRC-CDs-H + CCl4, 9.33 mg/kg), medium dose of CRC-CDs + CCl4 group (CRC-CDs-M + CCl4, 4.67 mg/kg), low dose of CRC-CDs + CCl4 group (CRC-CDs-L + CCl4, 2.34 mg/kg) and high dose of CRC-CDs group (CRC-CDs-H, 9.33 mg/kg). data were expressed as means ± standard deviation. #p < 0.05 and ##p < 0.01 vs. normal control group, *p < 0.05 and **p < 0.01 vs. CCl4 group.
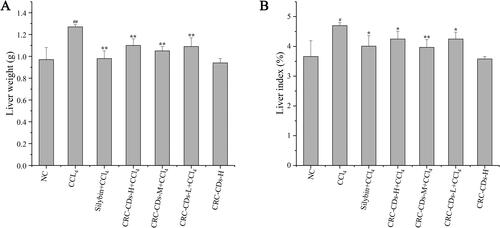
Figure 7. Effects of CRC-CDs on the appearance and pathological changes of liver tissue in mice with carbon tetrachloride-induced liver fibrosis. (A) Appearance of liver tissue, (B) HE staining (× 100), (C) Masson staining (× 100), (D) Sirius red staining (× 100). Mice were assigned into seven groups, namely normal control group (NC), CCl4 group (CCl4), silybin + CCl4 group (silybin + CCl4), high dose of CRC-CDs + CCl4 group (CRC-CDs-H + CCl4), medium dose of CRC-CDs + CCl4 group (CRC-CDs-M + CCl4), low dose of CRC- CDs + CCl4 group (CRC-CDs-L + CCl4) and high dose of CRC-CDs group (CRC-CDs-H).
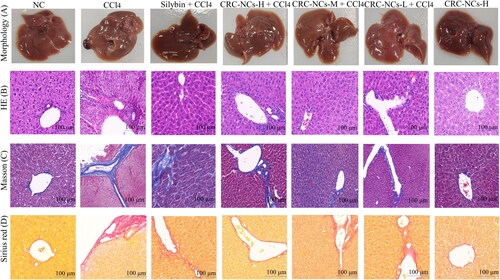
Figure 8. Effects of CRC-CDs on the contents of (A) ALT, (B) AST, (C) TBIL, (D) DBIL, (E) TBA, and (F) TG in serum of mice with carbon tetrachloride-induced liver fibrosis. Mice were assigned into seven groups, namely normal control group (NC), CCl4 group (CCl4), silybin + CCl4 group (silybin + CCl4), high dose of CRC-CDs + CCl4 group (CRC-CDs-H + CCl4, 9.33 mg/kg), medium dose of CRC-CDs + CCl4 group (CRC-CDs-M + CCl4, 4.67 mg/kg), low dose of CRC-CDs + CCl4 group (CRC-CDs-L + CCl4, 2.34 mg/kg) and high dose of CRC-CDs group (CRC-CDs-H, 9.33 mg/kg). data were expressed as means ± standard deviation (SD). ##p < 0.01 vs. normal control group, *p < 0.05 and **p < 0.01 vs. CCl4 group.
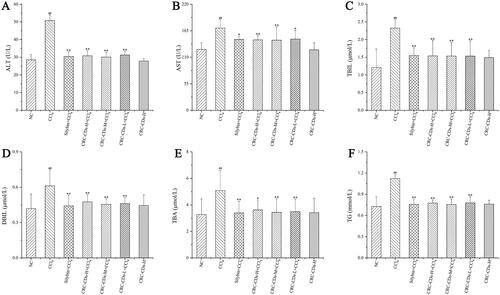
Figure 9. Effects of CRC-CDs on the contents of (A) TNF-α, (B) IL-6 and (C) IL-1β in serum of mice with carbon tetrachloride-induced liver fibrosis. Mice were assigned into seven groups, namely normal control group (NC), CCl4 group (CCl4), silybin + CCl4 group (silybin + CCl4), high dose of CRC-CDs + CCl4 group (CRC-CDs-H + CCl4, 9.33 mg/kg), medium dose of CRC-CDs + CCl4 group (CRC-CDs-M + CCl4, 4.67 mg/kg), low dose of CRC-CDs + CCl4 group (CRC-CDs-L + CCl4, 2.34 mg/kg) and high dose of CRC-CDs group (CRC-CDs-H, 9.33 mg/kg). data were expressed as means ± standard deviation (SD). ##p < 0.01 vs. normal control group, **p < 0.01 vs. CCl4 group.
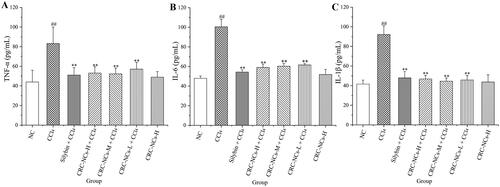
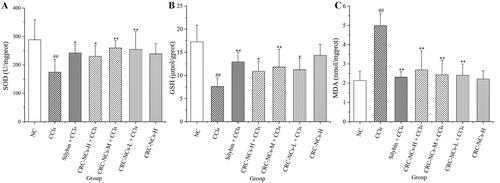
Figure 10. Effects of CRC-CDs on the content of (A) SOD, (B) GSH, and (C) MDA in liver tissue homogenate of mice with carbon tetrachloride-induced liver fibrosis. Mice were assigned into seven groups, namely normal control group (NC), CCl4 group (CCl4), silybin + CCl4 group (silybin + CCl4), high dose of CRC-CDs + CCl4 group (CRC-CDs-H + CCl4, 9.33 mg/kg), medium dose of CRC-CDs + CCl4 group (CRC-CDs-M + CCl4, 4.67 mg/kg), low dose of CRC-CDs + CCl4 group (CRC-CDs-L + CCl4, 2.34 mg/kg) and high dose of CRC-CDs group (CRC-CDs-H, 9.33 mg/kg). data were expressed as means ± standard deviation (SD). #p < 0.05 and ##p < 0.01 vs. normal control group, *p < 0.05 and **p < 0.01 vs. CCl4 group.
Data availability statement
The data that support the findings of this study are available from the corresponding author upon reasonable request.