
Figures & data
Figure 1. Diagram of tumour oxygenation after HBOC administration in the large tumour model.
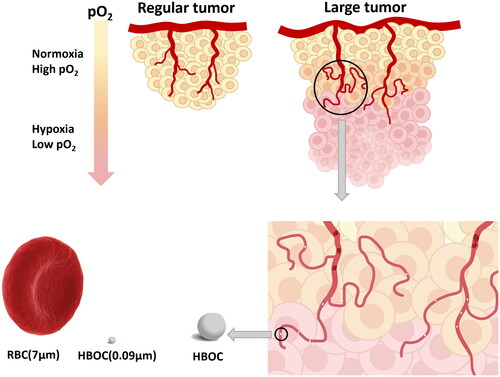
Figure 2. Tumour suppression experiment of Miacapa-2 cell model. (A) Schematic illustration of experimental scheme for the Miacapa-2 cell tumour model. (B) The photographs of tumours, (C) tumour volume curves of mice treated with various treatments, and (D) tumour weight of mice in different groups at the end of experiment of 100 mm3 group (n = 5). (E) The photographs of tumours, (F) tumour volume curves of mice treated with various treatments, and (G) tumour weights of mice in different groups at the end of experiment of 360 mm3 group (n = 7). (H) Representative fluorescence images and (I) AOD of tumour slices (360 mm3) stained by TUNEL (n = 3). Scale bar = 50 μm. Data between two groups was compared by students t-test. *p < 0.05.
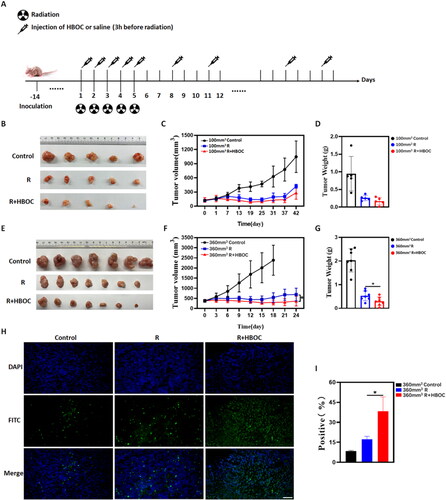
Figure 3. Tumour suppression experiment of Hela cell tumour model. (A) Schematic illustration of experiment scheme of Hela cell tumour model. (B) The photographs of tumours, (C) tumour volume curves, and (D) tumour weight of mice in different groups at the end of experiment (n = 4). (E) Representative images of histological slices from different groups (n = 3). Scale bar = 100 μm. Data between two groups was compared by student’s t-test. *p < 0.05.
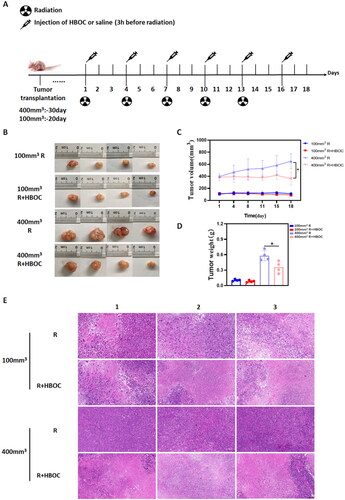
Figure 4. Hypoxia alleviation effect of HBOC in tumour-bearing mice. IHC staining of Hif-1α in (A) Miapaca-2 cell tumour model and (C) Hela cell tumour model. The AOD analysis of (B) Miapaca-2 cell tumour model and (D) Hela cell tumour model. (E) WB and (F) its stripe gray ratio of Hif-1α in the regular Hela tumour model (100 mm3) and large tumour model (400 mm3). (G) Immunofluorescence staining of hypoxyprobe and (H) AOD result in the Hela tumour model. Representative images of each group were shown. Scale bar = 50 μm. Data between two groups was compared by student’s t-test (n = 3). *p < 0.05.
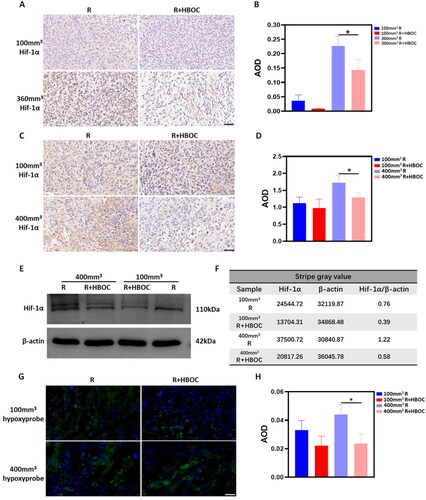
Figure 5. Tumour metastasis and invasion in vivo. (A) IHC staining of Ki67 and (B) AOD analysis in Hela tumour model. (C) IHC staining of CC3 and (D) AOD analysis in Hela tumour model. (E) IHC staining of CD31 and (F) AOD in analysis in Hela tumour model. Representative images of each group were shown. Scale bar = 50 μm. Data between two groups was compared by student’s t-test (n = 3). *p < 0.05. **p < 0.01.
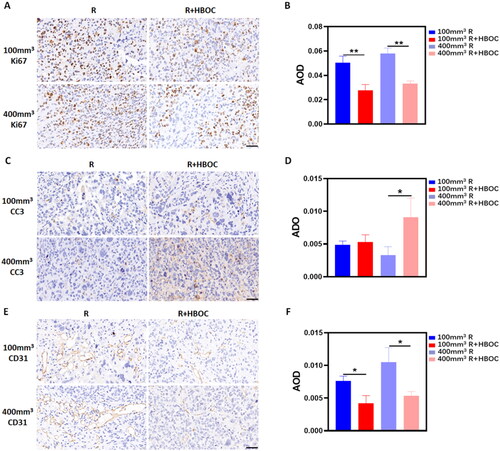
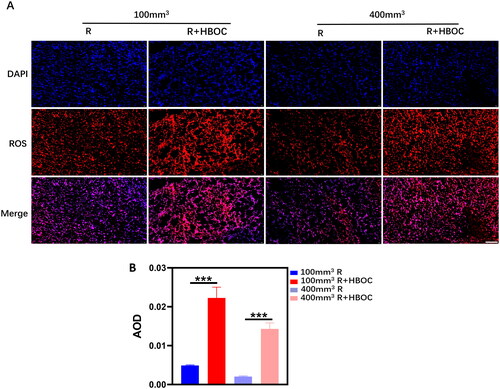
Figure 6. (A) Frozen section staining of ROS in the regular HeLa tumour model (100 mm3) and large tumour model (400 mm3). Scale bar = 50 μm. (B) The AOD statistical analysis of ROS (n = 3). ***p < 0.001.
Supplemental Material
Download MS Word (465.9 KB)Data availability statement
The data supporting the findings of this study are available within the article and its Supplementary Materials.