
Figures & data
Figure 1. Flow diagram of Zingiberis rhizoma-based carbon dots preparation process.
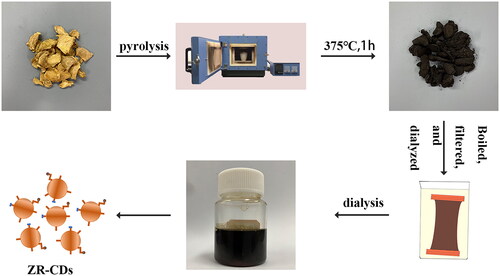
Figure 2. The morphology characterisation of ZR-CDs. (A) Transmission electron microscopy image. (B) High-resolution transmission electron microscopy image. (C) Particle size distribution histogram. (D) X-ray diffraction pattern.
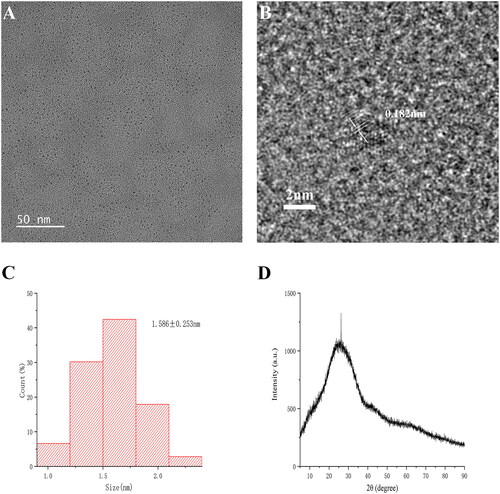
Figure 3. Optical characterization and HPLC analysis of ZR-CDs. (A) Fluorescence spectra: the maximum excitation and emission spectra. (B) Fourier transforms infra-red spectroscopy spectrum. High-performance liquid chromatography fingerprint of (C) Zingiberis hizome and (D) ZR-CDs, respectively.
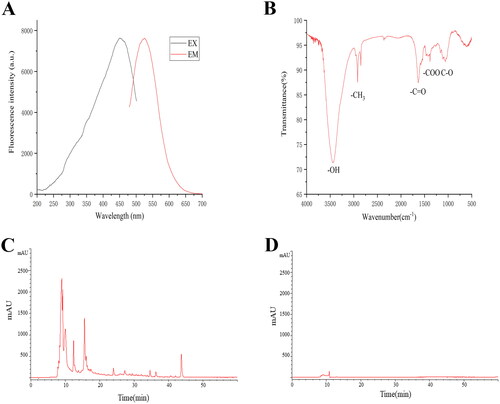
Figure 4. The X-ray photoelectron spectroscopy spectrum of ZR-CDs. (A) The full survey spectrum. The high-resolution survey spectrum of (B) C1s, (C) O1s, and (D) N1s, respectively.
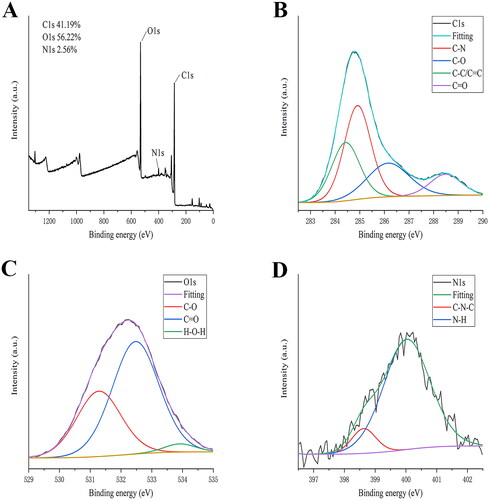
Figure 5. Effect of ZR-CDs on serum oestradiol, FSH, and LH levels in normal female mice. (A) Serum oestradiol levels. (B) Serum FSH levels. (C) Serum LH levels. *p < 0.05 and **p < 0.01, compared with the control group. H: high dose of ZR-CDs, M: medium dose of ZR-CDs, L: low dose of ZR-CDs. N = 8 (each group).
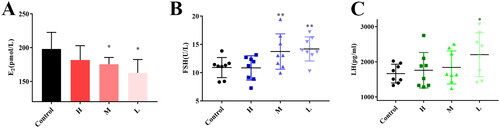
Figure 6. Time curvy of ZR-CDs on serum oestradiol in normal female mice. Compared with the control group, #p < 0.05. Compared with the model group, *p < 0.05. N = 6 (each group).
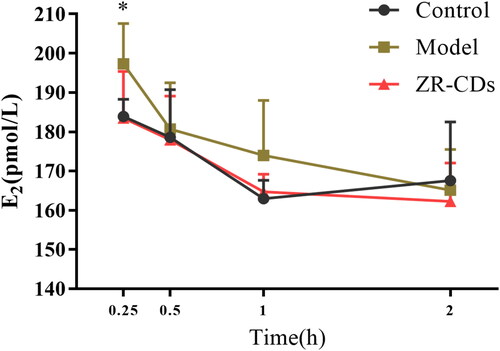
Figure 7. Effect of ZR-CDs on serum oestradiol, FSH, and LH levels in female mice after administration of exogenous oestradiol. (A) Serum oestradiol levels. (B) Serum FSH levels. (C) Serum LH levels. #p < 0.05, compared with the control group *p < 0.05, compared with the model group. H: high dose of ZR-CDs, M: medium dose of ZR-CDs, L: low dose of ZR-CDs. N = 8 (each group).
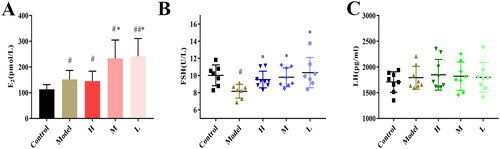
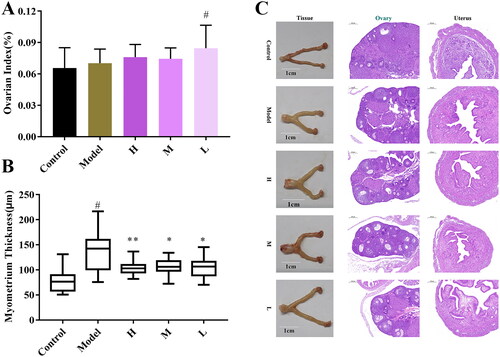
Figure 8. Effect of ZR-CDs on the sexual organs of female mice after exogenous oestrogen administration. (A) Ovarian index. (B) Endometrial thickness of the uterus. (C) HE stains of uterus and ovaries, ×50. #p < 0.05, compared with the control group *p < 0.05 and **p < 0.01, compared with model group. H: high dose of ZR-CDs, M: medium dose of ZR-CDs, L: low dose of ZR-CDs. N = 8(each group).
Data availability statement
The original data for this study support the findings and conclusions of the article and are available if required.