
Figures & data
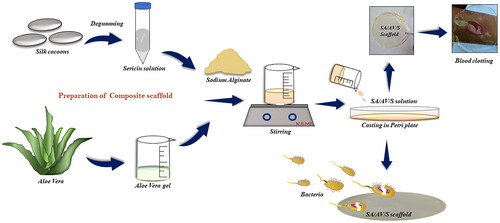
Figure 1. Schematic representation showing the various steps involved in the fabrication of SA/AV/S scaffold.
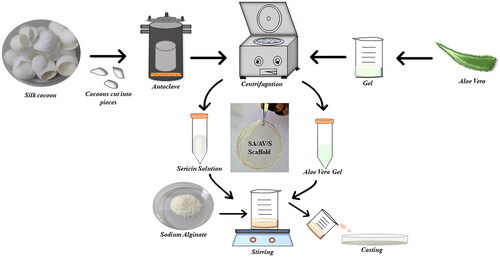
Figure 2. (A) and (B) SEM images of SA/AV/S scaffold.
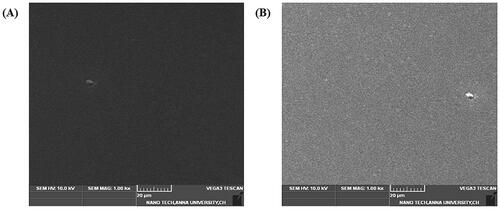
Figure 3. UV–visible absorption spectra of (A) sericin (S), (B) aloe vera (AV), (C) sodium alginate (SA) and (D) SA/AV/S scaffold.
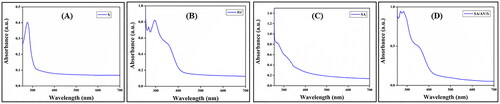
Figure 4. (A) FTIR spectra of SA, AV, S and SA/AV/S scaffold, respectively.
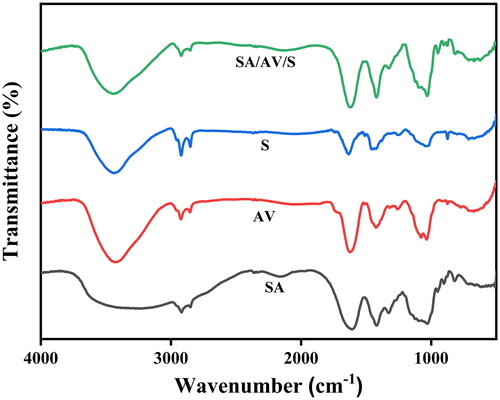
Figure 5. (A) Swelling ratio of SA/AV/S scaffold in PBS at different time intervals. (B) Haemolytic assay for SA/AV/S scaffold performed using human erythrocytes. Water and PBS treated with RBCs were used as positive and negative control, respectively.
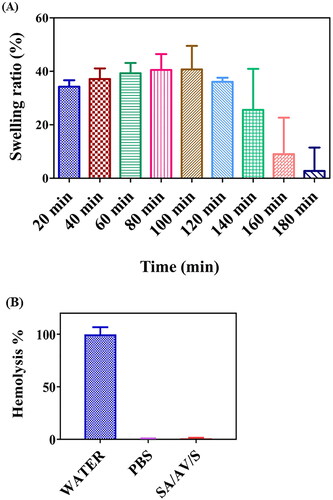
Figure 6. ( A) In vitro whole blood clotting assay for SA, AV, S and SA/AV/S scaffold, respectively. (B) Blood absorption assay for SA/AV/S scaffold. (C) Percentage of blood absorption for SA, AV, S and SA/AV/S scaffold, respectively.
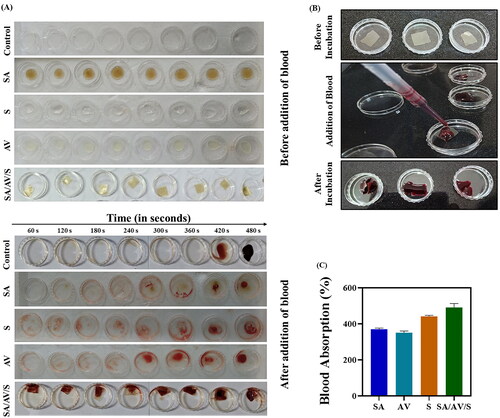
Figure 7. ( A) Turbidity analysis showing the images of tubes containing negative control, blank and E. coli strain incubated with SA/AV/S scaffold. (B) Turbidity analysis showing the optical density of negative, blank and SA/AV/S scaffold. (C) Zone of inhibition formed after treating with SA/AV/S scaffold.
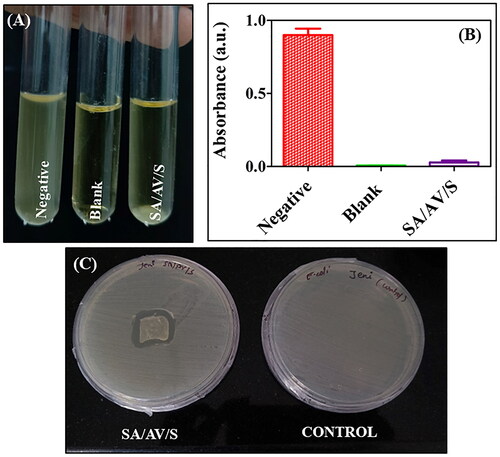
Figure 8. (A) MTT assay for different concentrations of SA/AV/S scaffold on human skin keratinocyte cells. (B) In vitro scratch wound assay – Photos were taken at 0, 24 and 48 h.
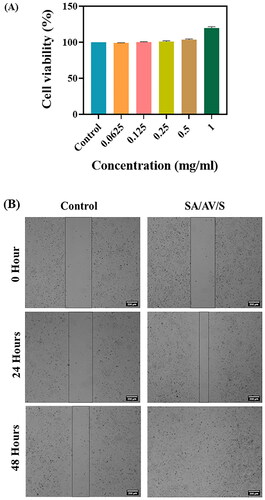
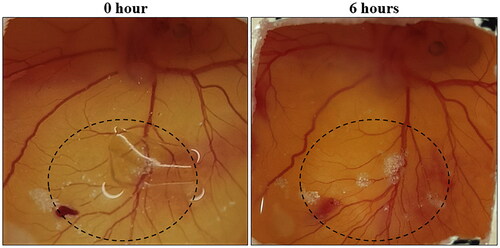
Figure 9. Images of CAM assay for SA/AV/S scaffold. The area within the circle was used to determine the formation of new blood vessels after incubation.
Data availability statement
The authors state that all data related to this study are available within the article.