
Figures & data
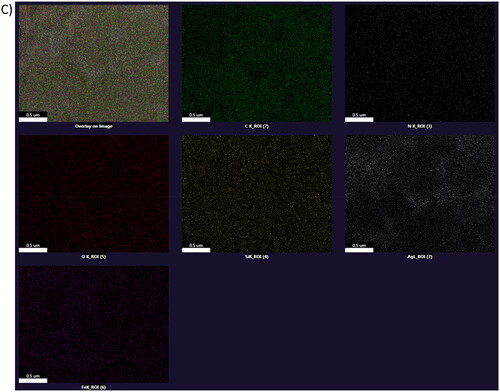
Figure 2. DLS of synthesised Fe3O4@SiO2@PDA@Ag (medium: Water; size, d: 139.1 nm).
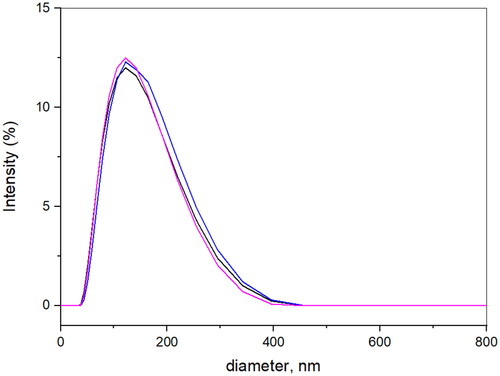
Figure 3. Zeta potential distribution image of synthesised Fe3O4@SiO2@PDA@Ag.
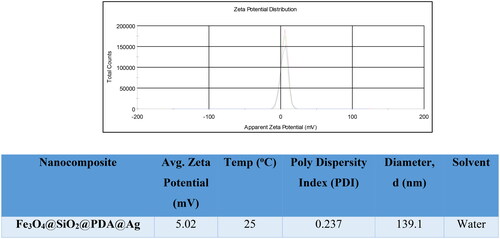
Figure 4. FT-IR of (a) Fe3O4, (b) Fe3O4@SiO2, (c) Fe3O4@SiO2@PDA, and (d) Fe3O4@SiO2@PDA@Ag nanocomposite.
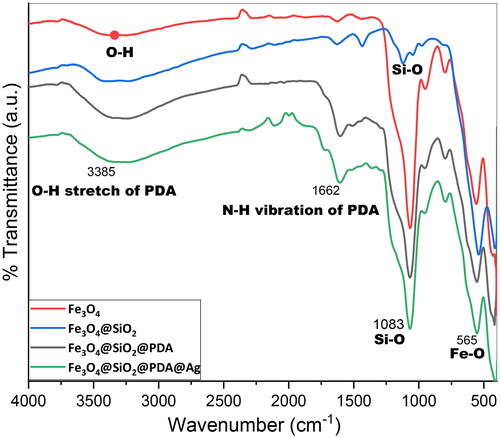
Figure 5. XRD of Fe3O4@SiO2@PDA@Ag nanocomposite.
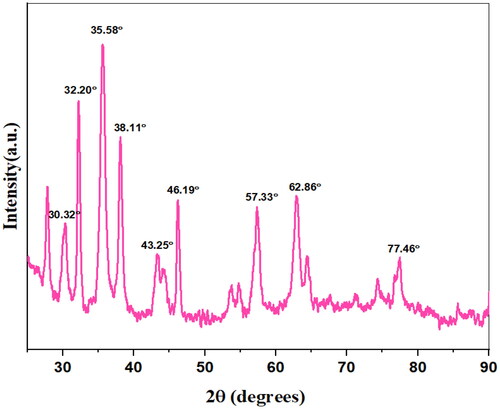
Figure 6. EDAX of Fe3O4@SiO2@PDA@Ag nanocomposite.
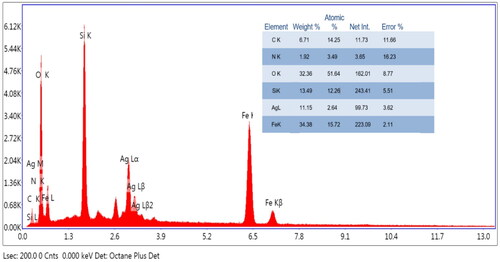
Figure 7. Stability data of Fe3O4@SiO2@PDA@Ag nanocomposite in water, PBS, acidic and basic buffers.
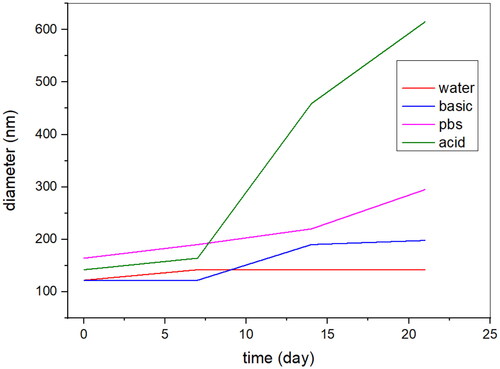
Figure 8. MTT assay at various concentrations on H1299 cancer cell line; (A) % cell viability of Fe3O4@SiO2@PDA (B) % cell viability of Fe3O4@SiO2@PDA@Ag C) comparison of % cell cytotoxicity of Fe3O4@SiO2@PDA and Fe3O4@SiO2@PDA@Ag.
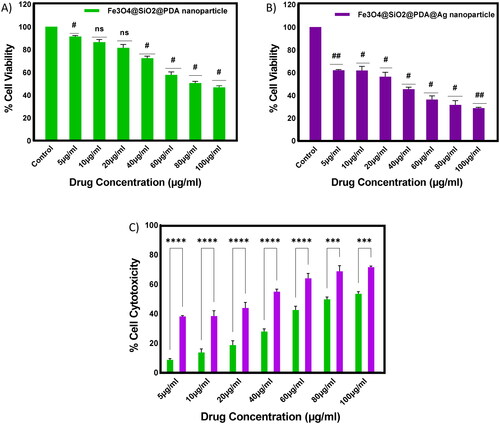
Figure 9. Microscopic images of the effect of the Fe3O4@SiO2@PDA@Ag nanoparticles on H1299 cancer cell line. (A) Untreated/control (B) at 50 µg/mL.
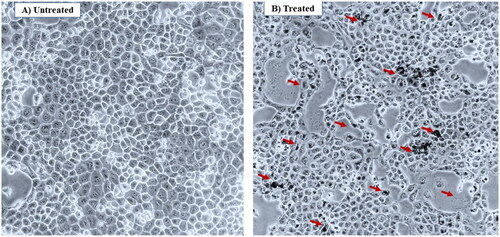
Figure 10. Cell apoptosis assay at different concentrations of Fe3O4@SiO2@PDA@Ag on H1299 cancer cell line (A) control; 0 µg/mL, (B) 20 µg/mL, (C) 30 µg/mL.
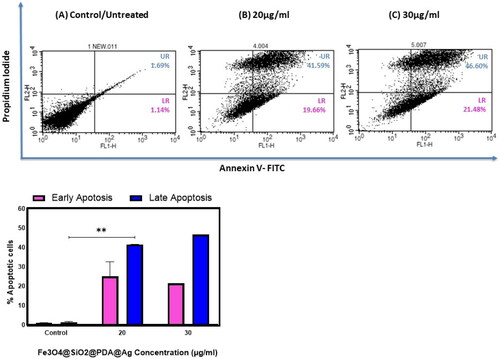
Figure 11. Antibacterial activity of Fe3O4@SiO2@PDA@Ag nanocomposites with increasing concentrations against (A) S. aureus and (B) P. aeruginosa.
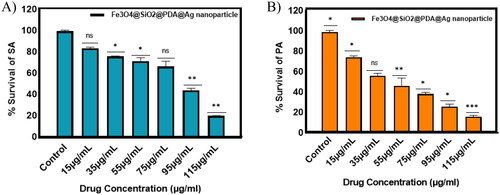
Figure 12. Scanning electron micrographs of (A) and (B) untreated P. aeruginosa cells and its EDAX composition (C) and (D) cells treated with Fe3O4@SiO2@PDA@Ag nanocomposites at MIC and its EDAX composition.
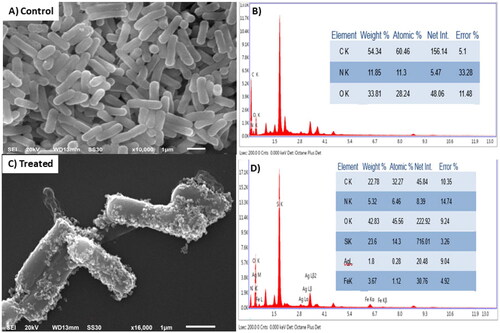
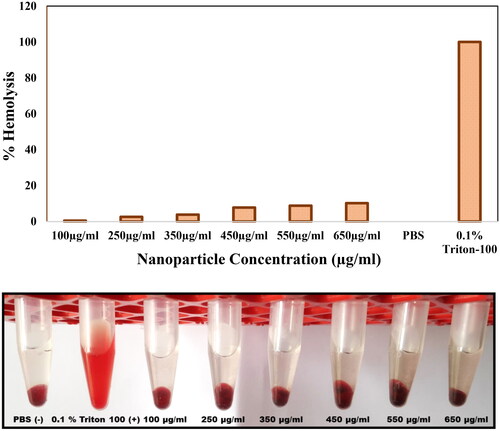
Figure 13. Haemolysis assay of Fe3O4@SiO2@PDA@Ag nanoparticle at various concentrations.
Data availability statement
Raw data available on request.