
Figures & data
Figure 1. Interstitial oxygen tension (PISFO2) of skeletal muscle capillary beds. The microvasculature of the spinotrapezius muscle was monitored at specific sites for interstitial fluid oxygenation throughout the experimental time course. Two-Way ANOVA detected no differences up to 60 min but saw post-treatment separation between NS and oxygen-containing treatments. About 40% FiO2 was higher than Ox66 for time points 60 and 75 (not illustrated). Data are mean SEM. Statistical annotation colour-coded to indicate significance vs. NS. *p < 0.05 vs. NS.
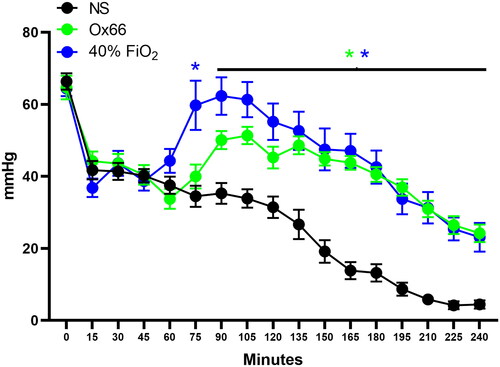
Table 1. Arterial blood gasses and metabolites.
Figure 2. The PAO2/FiO2 index of pulmonary function. Arterial blood samples were used to measure PAO2, which was then divided by the fraction of inspired oxygen (FiO2) – 21% for NS and Ox66. 40% FiO2 returned the index to BL, while NS and Ox66™ had similar profiles. N = 8 per group. Data are mean ± SEM. βp < 0.05 vs. 0 min.
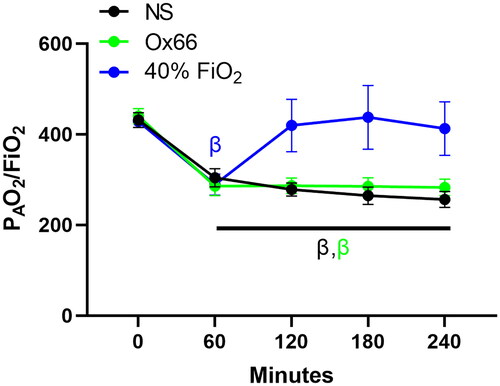
Figure 3. Mean arterial pressure. Arterial pressure data were collected continuously through an indwelling catheter and plotted at discrete time points to align with PISFO2 collection. Measurements before treatment did not differ between groups. NS and Ox66™ were virtually identical and remained suppressed from their BL. About 40% FiO2 was significantly elevated against most NS and Ox66 time points after treatment. It was also suppressed versus its BL but at a lower magnitude. Statistical annotations are colour-coded to correspond to their specific group. N = 8 per group. Data are mean ± SEM. *p < 0.05 vs. NS. αp < 0.05 vs. Ox66.
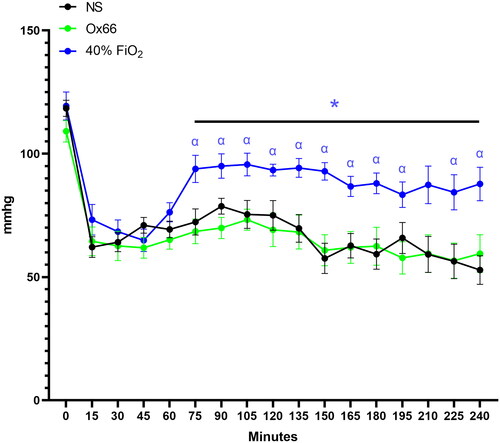
Table 2. Inflammatory biomarkers.