
Figures & data
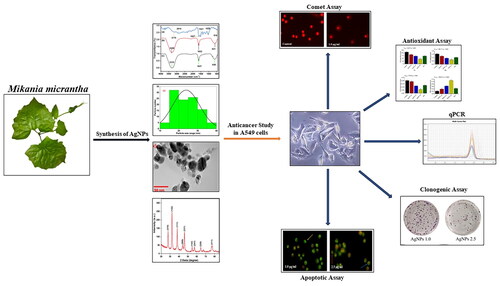
Figure 1. Visual identification of biosynthesized AgNPs as recorded at different time-interval: (a) Initial, (b) 2 h, and (c) 4 h. The formation of reddish-brown colour revealed the formation of AgNPs in the reaction mixture.
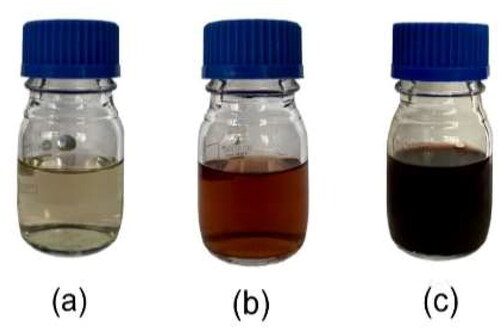
Figure 2. UV-Vis absorption spectra of biosynthesized AgNPs using M. micrantha leaf extract at different time intervals.
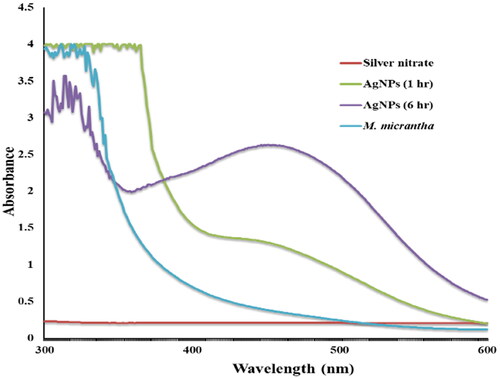
Figure 3. FT-IR analysis of (a) biosynthesized AgNPs (b) M. micrantha leaf extract (MMAE), and (c) Silver nitrate.
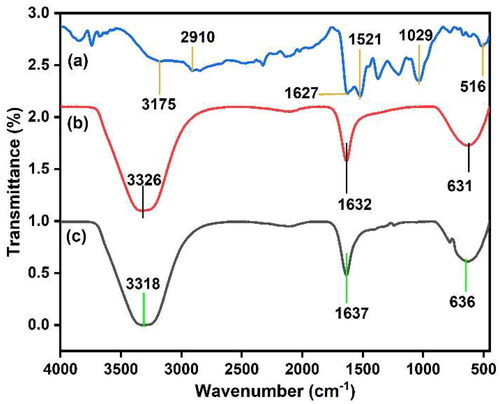
Figure 4. (a–d) SEM micrographs of biosynthesized AgNPs. Elemental mapping of silver (e), and oxygen (f), and both elements (g) for the inset region, and (h) EDS data of the area in the white box in (c). Scale bars: (a) 1 µm (b) 10 µm (c) 100 µm, and (e–g and inset) 1 µm.
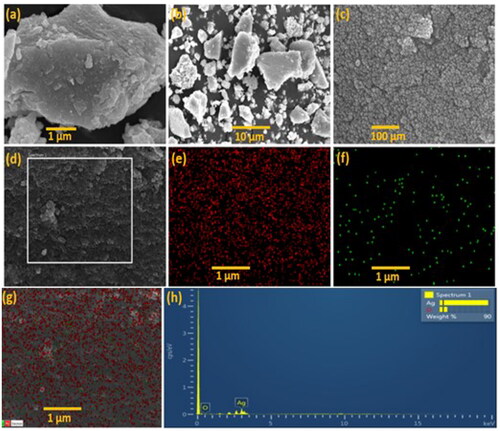
Figure 5. (a–d) TEM micrograph showing size of biosynthesized AgNPs. Scale bars: (a) 10 nm, (b) 20 nm, (c) 50 nm, and (d) 100 nm. (e) Histogram of the TEM image (100 nm).
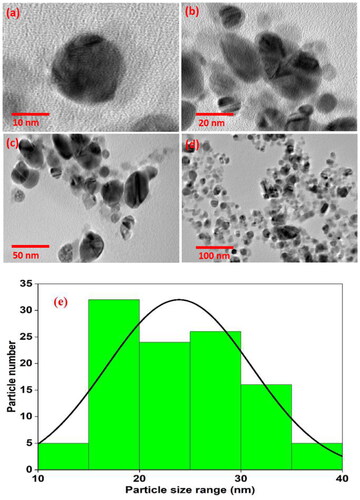
Figure 6. XRD pattern of biosynthesized AgNPs using M. micrantha leaf extract.
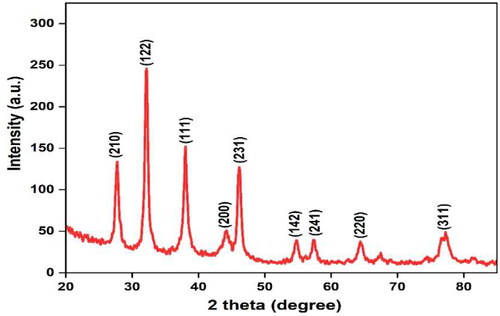
Figure 7. Plots of log-doses of various concentration of AgNPs in triplicate against inhibition (%) of A549 cells after 24 h treatment for the calculation of IC50.
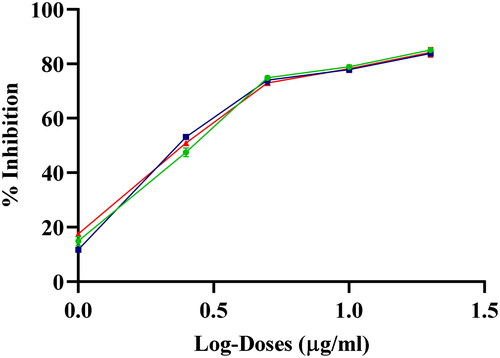
Figure 8. (a) Inhibition of colony formation of A549 cells mediated by AgNPs. (b) Effect of AgNPs on the reproductive viability of A549 cells, expressed as a surviving fraction (SF). Control: A549 cells without treatment; AgNPs 1.0, AgNPs 2.5 and AgNPs 5.0: A549 cells treated with 1.0, 2.5 and 5.0 µg/mL of AgNPs respectively; 5FU: A549 cells treated with 100 µg/mL of 5FU (positive control). Values are expressed as Mean ± SEM. Different letters indicate significant variation.
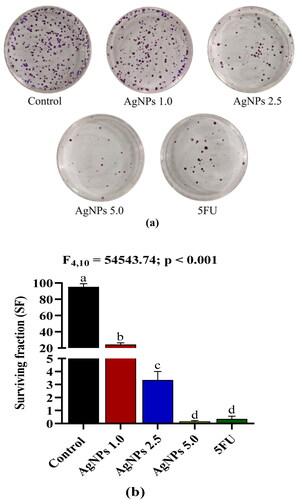
Figure 9. (a) Acridine orange/Ethidium bromide (AO/EtBr) dual staining of A549 cells after treatment with different doses of AgNPs for 24 h (yellow arrow shows the live cells, red arrow shows apoptotic cells with nuclear condensation, and blue arrow shows apoptotic cells with nuclear fragmentation). (b) Percentage of dead cells after treatment of A549 with biosynthesized AgNPs. Control: A549 cells without treatment; AgNPs 1.0, AgNPs 2.5 and AgNPs 5.0: A549 cells treated with 1.0, 2.5 and 5.0 µg/mL of AgNPs respectively; 5FU: A549 cells treated with 100 µg/mL of 5FU (positive control). Values are expressed as Mean ± SEM. Different letters indicate significant variation.
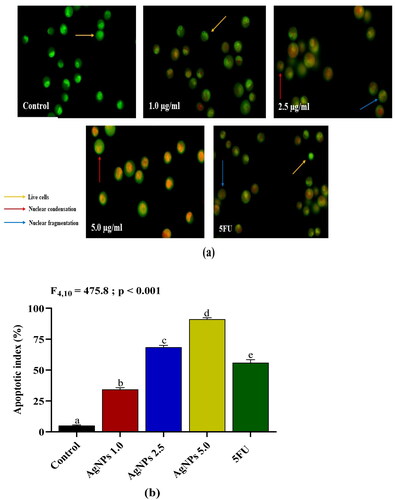
Figure 10. (a) Fluorescence images of Comets observed in control and A549 cells treated with different concentrations of AgNPs. (b–e) The extent of DNA damage expressed in terms of tail area, tail length, tail DNA and tail olive moment. Control: A549 cells without treatment; AgNPs 1.0, AgNPs 2.5 and AgNPs 5.0: A549 cells treated with 1.0, 2.5 and 5.0 µg/mL of AgNPs respectively; 5FU: A549 cells treated with 100 µg/mL of 5FU. Values are expressed as Mean ± SEM. Different letters indicate significant variation.
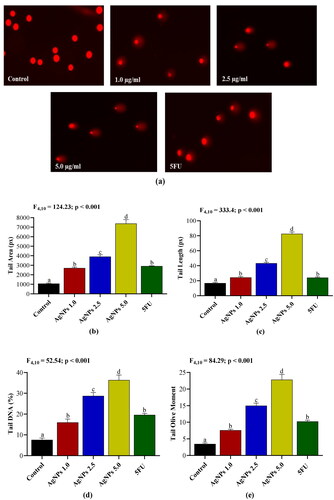
Figure 11. Effects of AgNPs on (a) glutathione (GSH) level; (b) glutathione-s-transferase (GST) activity; (c) superoxide dismutase (SOD) activity; and (d) lipid peroxidation (LPO) expressed in malondialdehyde (nmol/mg protein) in A549 cells after 24 h treatment. Control: A549 cells without treatment; AgNPs 1.0, AgNPs 2.5 and AgNPs 5.0: A549 cells treated with 1.0, 2.5 and 5.0 µg/mL of AgNPs respectively; 5FU: A549 cells treated with 100 µg/mL of 5FU. Values are expressed as Mean ± SEM. Different letters indicate significant variation.
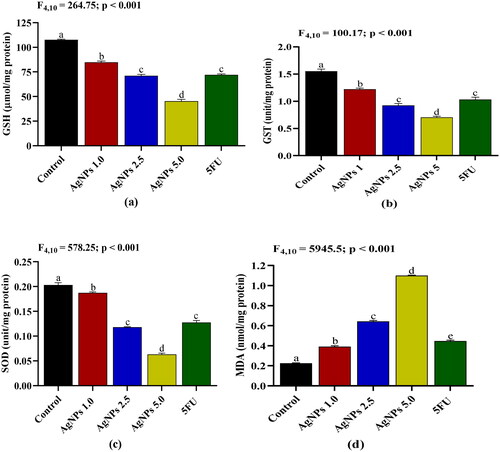
Figure 12. Effects of AgNPs on mRNA expression levels of (a) Bax; (b) Bid; (c) p53; (d) Apaf-1; (e) BCl- XL; (f) BCl-2; (g) Survivin and (h) PARP in A549 cells after 24 h treatment. Control: A549 cells without treatment; AgNPs: A549 cells treated with 2.5 µg/mL of AgNPs; 5FU: A549 cells treated with 100 µg/mL of 5FU. Values are expressed as Mean ± SEM. Different letters indicate significant variation.
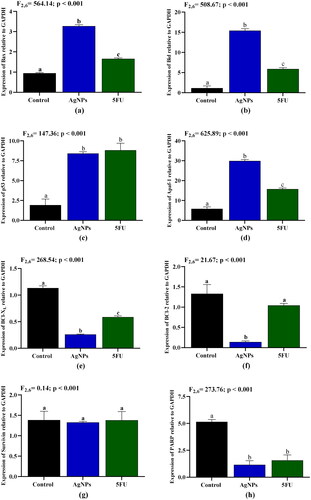
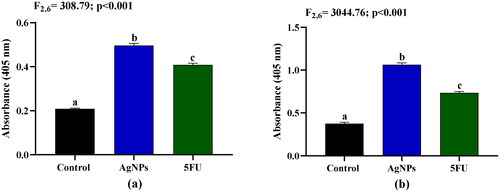
Figure 13. Effects of AgNPs on activities of (a) Caspase-3 and (b) Caspase-6 in A549 cells after 24 h treatment. Control: A549 cells without treatment; AgNPs: A549 cells treated with 2.5 µg/mL of AgNPs; 5FU: A549 cells treated with 100 µg/mL of 5FU. Values are expressed as Mean ± SEM. Different letters indicate significant variation.
Data availability statement
The article contains all the data necessary to understand the conclusions of this investigation.