
Figures & data
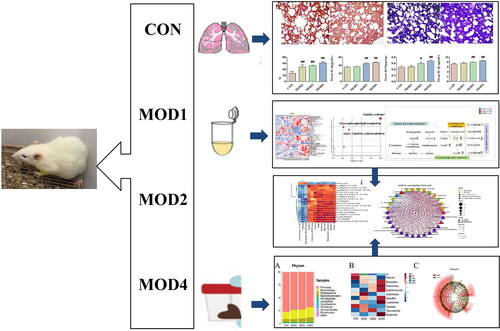
Figure 1. The histopathological changes and biochemical indicators of lung tissues in the CON, MOD1, MOD2 and MOD4 groups. (A) Representative photomicrographs of HE and Masson staining (HE and Masson staining ×100). (B) Staining score and biochemical index results. *p < 0.05, **p < 0.01 vs. CON group (n = 10).
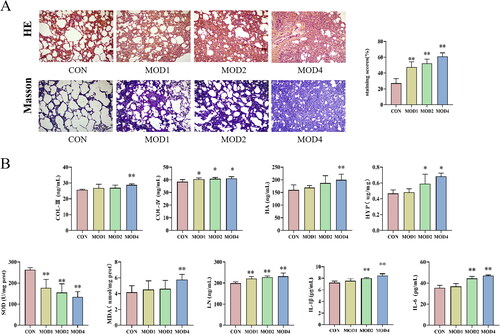
Figure 2. PF progression (A) PCA score plot. (B) PLS-DA score plot. (C) 3D PLS-DA score plots. OPLS-DA score plot in rats at (D) week 1, (E) weeks 2, and (F) week 4 of PF. V-plot score plot in rats at (H) week 1, (I) weeks 2 and (G) week 4 of PF (n = 6).
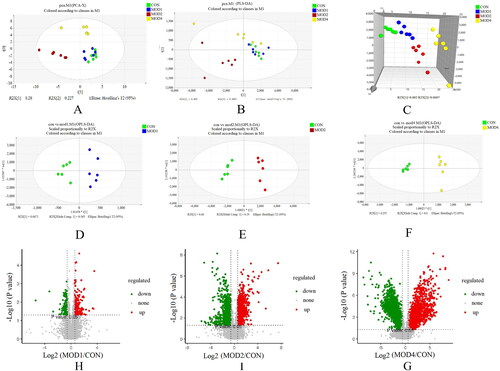
Figure 3. (A) Heat map of the differential metabolites in all groups. Colour saturation indicates the amount of metabolite expression. (B) p Value heat map of the differential metabolites in all groups. Red and blue indicating a relative increase and decrease, respectively (n = 6).
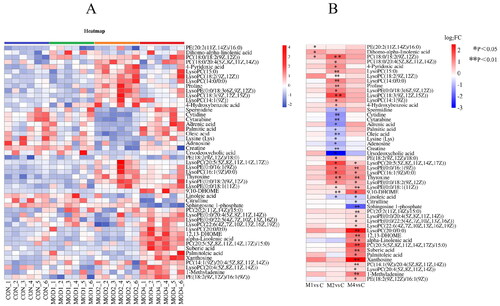
Table 1. Identification of differential metabolites at week 1 in rats with PF.
Table 2. Identification of differential metabolites at week 2 in rats with PF.
Table 3. Identification of differential metabolites at week 4 in rats with PF.
Figure 4. Metabolic pathway analysis of the differential metabolites in the MOD1 (A), MOD2 (B) and MOD4 (C) groups. Venn diagram of (D) metabolic pathways in each group and (E) potential biomarkers in metabolic pathways in each group (n = 6).
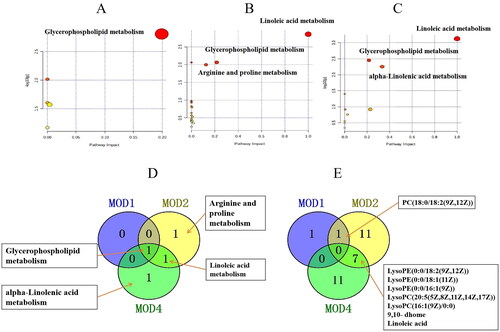
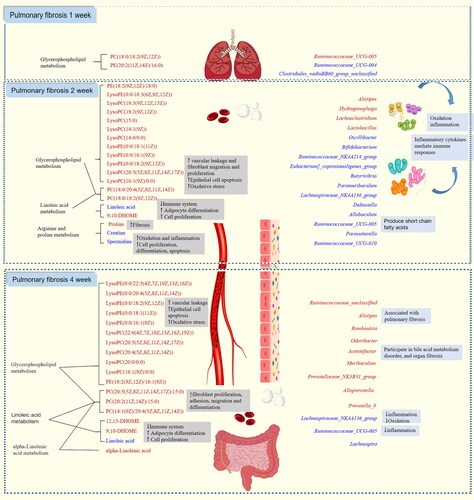
Figure 5. Network of metabolic pathways in PF.
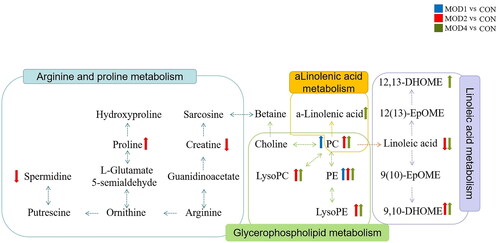
Figure 6. Analysis of diversity of intestinal microbiota in PF. (A) Chao1 indicator, (B) Shannon indicator, (C) Good’s coverage indicator, (D) NMDS analysis of the CON, MOD1, 2, 4 groups (n = 6) *p < 0.05 vs. CON group.
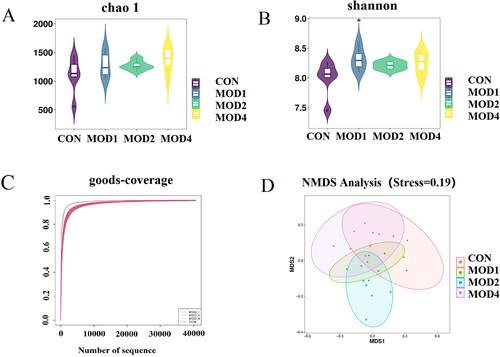
Figure 7. Species composition and cluster analysis of intestinal flora in the course of pulmonary fibrosis in rats (A) The top 10 phylum of intestinal microbiome (B)The heat map of the top 10 phylum; (C) Species composition of the top 30 genera (D) Heatmap of the top 30 genera (n = 6).
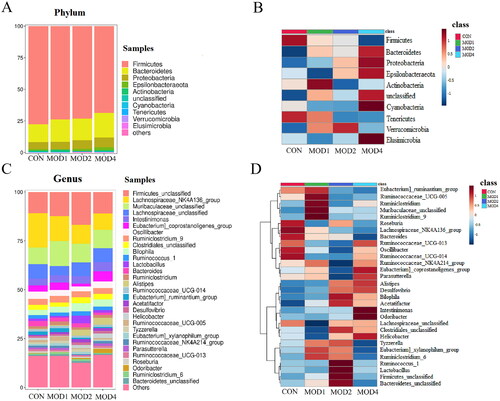
Figure 8. (A) LEfSe analysis and (B) LDA value distribution histogram of PF rats in each group; (C) Venn diagram of bacterial biomarkers in each week (n = 6).
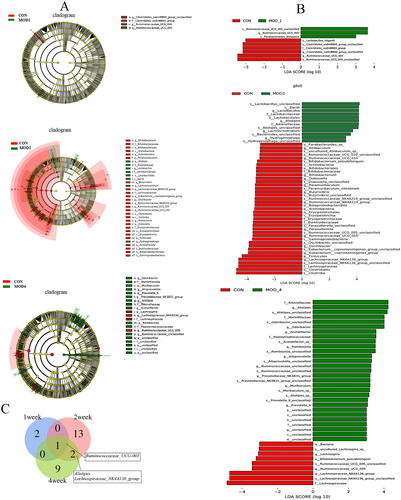
Figure 9. (A) Heat map of the relationship between key differential metabolites and key intestinal microbiota in rats with PF in each week. Red and blue indicate positive and negative correlations, respectively. (B) Correlation network of potential biomarkers in each week of PF rats (n = 6) *p < 0.05, **p < 0.01.
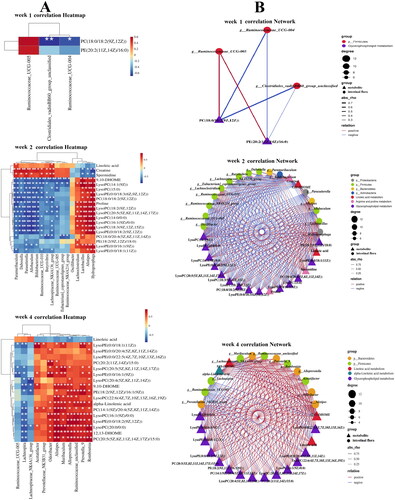
Figure 10. Study on the progression of pulmonary fibrosis disease based on metabolomics and intestinal flora. The red and blue characters in the figure indicate increased and decreased metabolite and intestinal flora abundance in each model group compared with the blank group, respectively.
Supplemental Material
Download MS Word (2.2 MB)Data availability statement
All data supporting the findings of this study are included in the article and its Supplementary Information files.