
Figures & data
Figure 1. The size, size distribution of (A) blank polybutylcyanoacrylate (PBCA) nanoparticles (NPs) and (B) ant-miR-126 loaded PBCA NPs.
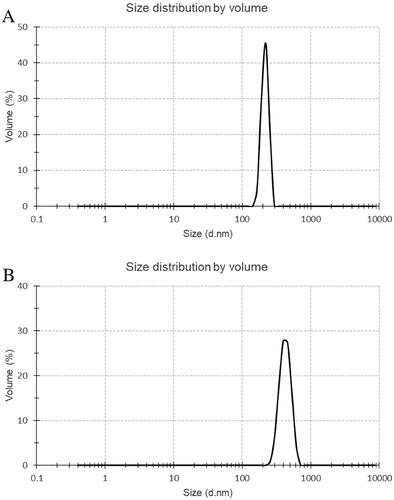
Figure 2. Zeta potential distribution of (A) blank PBCA NPs and (B) ant-miR-126 loaded PBCA NPs.
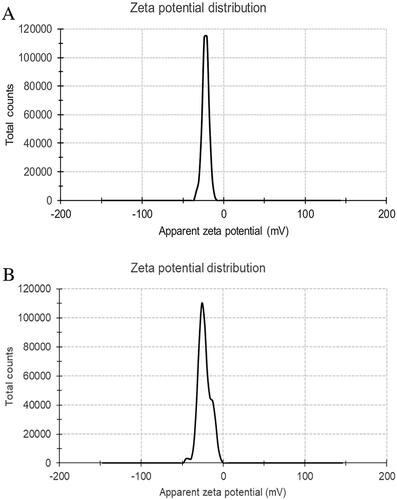
Figure 3. Morphology of blank PBCA NPs under transmission electron microscopy.
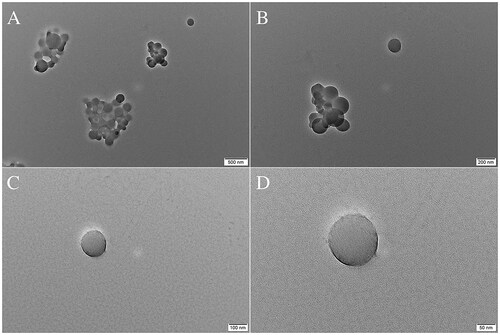
Figure 4. Morphology of ant-miR-126 loaded PBCA NPs under transmission electron microscopy.
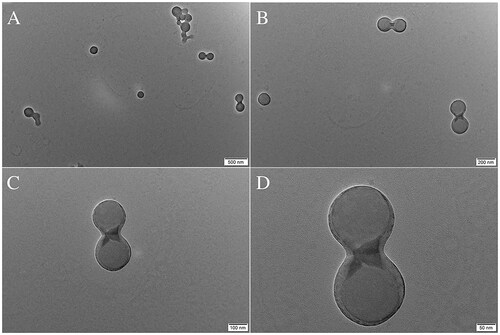
Figure 5. Scanning electron microscopy schematic diagram of blank PBCA NPs extraction solution (A1), ant-miR-126 loaded PBCA NPs extraction solution (B1). Smooth and full NPs can be seen, for example, where these arrows indicate.
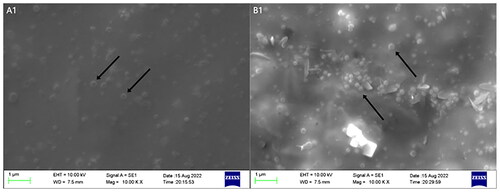
Figure 6. Schematic diagram of toxicity testing of PBCA NPs drug carrier. * indicates p < .05 compared with the control group.
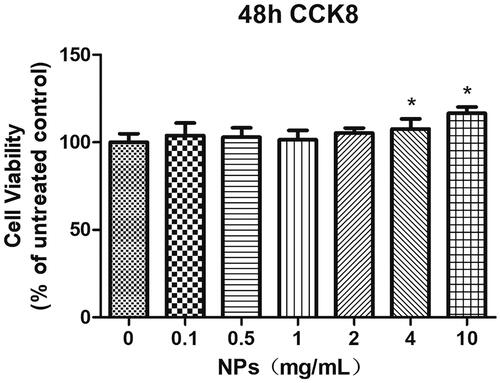
Figure 7. Depiction of qualitative representation of enhancement. Unprocessed images are displayed (a) before, (b) during, and (c) after injection of PBCA NPs. Corresponding processed images are displayed in (d–f). Enhancement is graded from minimal (blue) to maximal (red). Values are a percentage of the maximum grey level intensity difference.
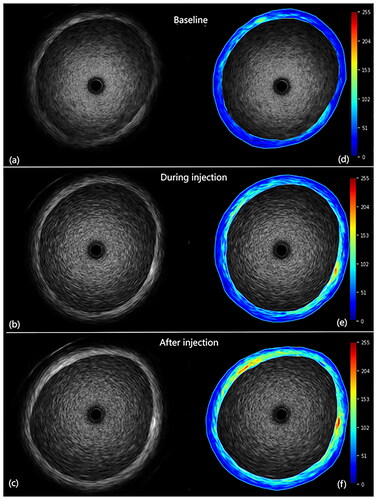
Figure 8. The mean enhancement in region of interest (MEIR) after PBCA NPs injection in the vascular wall regions.
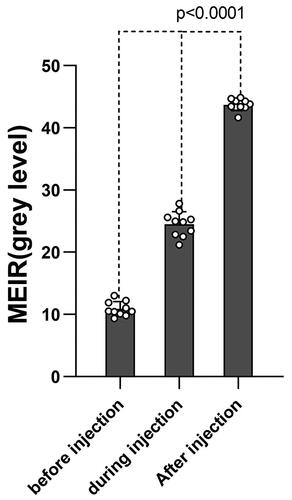
Table 1. Depiction of quantitative representation of enhancement.
Figure 9. Relative expression of SPRED1 and PI3KR2 in each group. The control group was performed on normal rat aortic endothelial cells, the model group was performed on a rat aortic endothelial cell injury model, and the treatment group was treated with the addition of the ant-miR-126 loaded PBCA NPs to the rat aortic endothelial cell injury model. * indicates p < .05 compared with the control group, # indicates p < .05 compared with the model group.
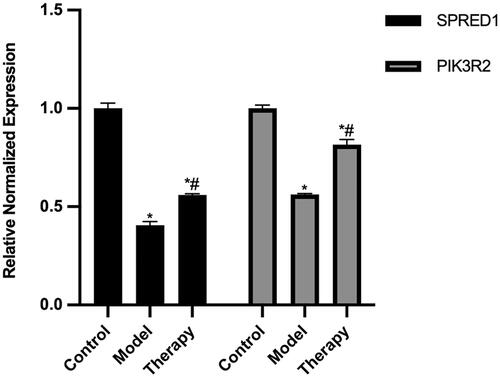
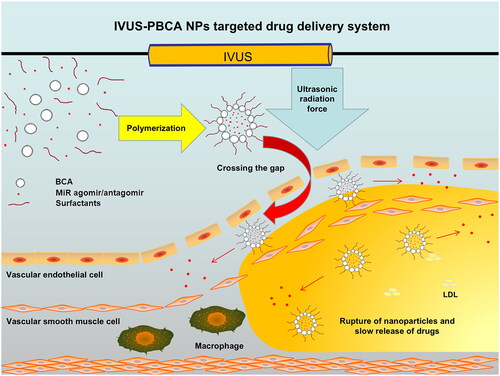
Figure 10. Schematic diagram of intravascular ultrasound (IVUS)-PBCA NPs targeted drug delivery system. Abbreviations: LDL, low density lipoprotein.
Data availability statement
The data that support the findings of this study are available from the corresponding author, Yunpeng Jin, upon reasonable request.