
Figures & data
Table 1. Phytochemical profiling of ECEE by LC-MS/MS analysis (positive mode ESI).
Table 2. Impact of ECEE on the biofilm formation of P. aeruginosa isolates.
Figure 1. Impact of ECEE on the gene expression of the biofilm-forming isolates.
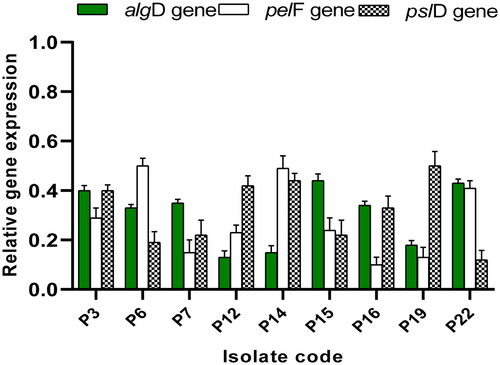
Figure 2. The bacterial load in lung tissues of the experimental groups. The two asterisks represent a significant difference (p < 0.05). The abbreviation (NS) denotes a non-significant difference (p > 0.05).
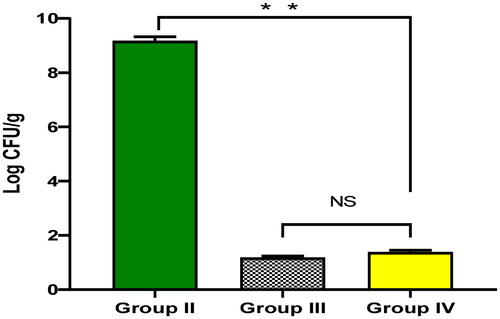
Figure 3. Histological features of the lung tissues stained with H&E of A) Group I with normal-sized alveoli separated by fibrous septa (blue arrows), normal-sized bronchioles (black arrows), and normal-sized blood vessels (red arrow) (×100). B) Group II with dilated destructed bronchioles (black arrows), surrounded by marked alveolar fibrosis (blue arrows), marked inflammation (green arrows), and vascular congestion (red arrow) (×100). C) Group III with normal-sized bronchioles (black arrows), surrounded by normal-sized alveoli (blue arrows) with focal alveolar and vascular congestion (red arrows) (×100). D) Group IV with dilated bronchiole (black arrow), surrounded by normal-sized alveoli (blue arrows) with focal alveolar congestion (red arrow) (×100).
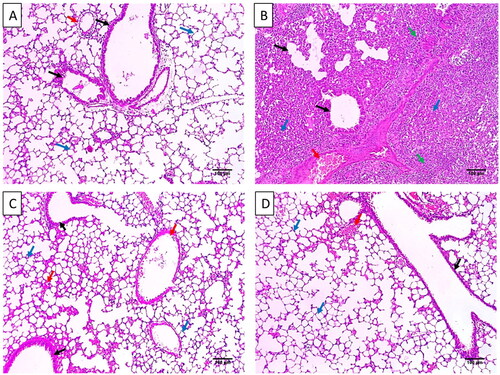
Figure 4. Masson’s trichrome staining of A) Group I with bronchioles and vessels surrounded by minimal blue stained collagen (red arrows) (×100). B) Group II with dilated bronchioles surrounded by marked fibrosis (red arrows) (×100). C) Group III with minimal fibrosis (red arrows) (×100). D) Group IV with mild fibrosis (red arrows) (×100).
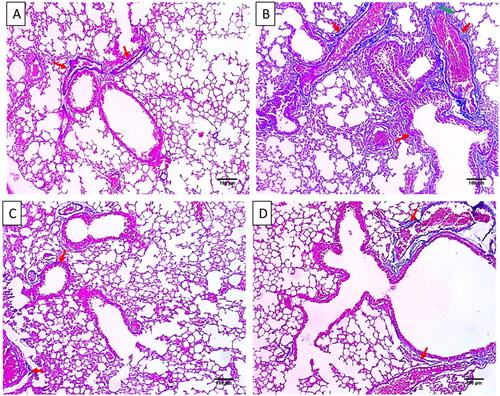
Figure 5. Immunostained lung sections of A) Group I exhibited a negative expression of caspase-3 (0.12%) (×100). B) Group II exhibited a strong positive caspase-3 expression (87.24%) (×100). C) Group III exhibited a weak positive caspase-3 expression (17.14%) (×100). D) Group IV exhibited a weak positive caspase-3 expression (18.16%). E) Group I presented a negative expression of NF-kB (2.63%) (×100). F) Group II exhibited a strong positive NF-kB expression (82.17%) (×100). G) Group III exhibiting a weak positive NF-kB expression (16.25%) (×100). H) Group IV exhibited a weak positive NF-kB expression (18.06%) (×100).
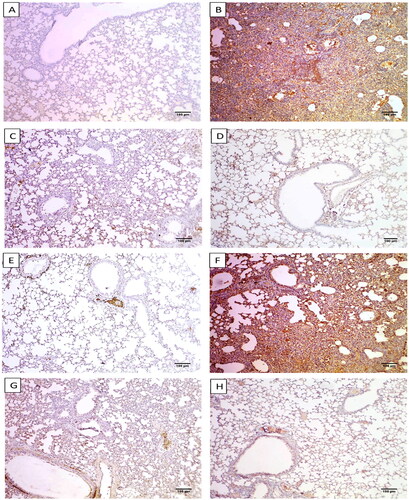
Figure 6. Impact of ECEE on the levels of A) NO and B) MDA. The two asterisks represent a significant difference (p < 0.05). The abbreviation (NS) denotes a non-significant difference (p > 0.05).
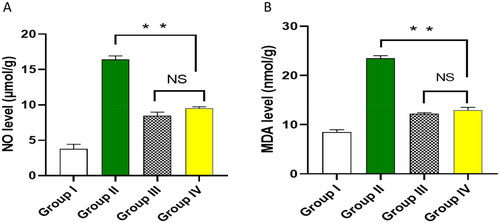
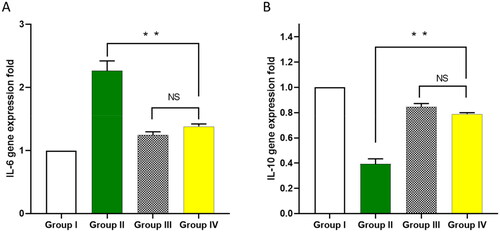
Figure 7. Influence of ECEE on the gene expression of A) IL-6 and B) IL-10. The two asterisks represent a significant difference (p < 0.05). The abbreviation (NS) denotes a non-significant difference (p > 0.05).
Supplemental Material
Download MS Word (19.1 KB)Data availability statement
All data that support the finding displayed in our study are included in the manuscript. Any further data is available upon request.