Figures & data
Figure 1. Flowchart for the study design and the subject’s screening/selection according to the inclusion and exclusion criteria.
Figure 2. Mean values with standard errors of VO2max in ml/kg per minute before (blue histograms) and after (white histograms) the period of training for E-types (n=3), N-types (n=5) and M-types (n=5), and all participants with valid VO2max results (n=13).
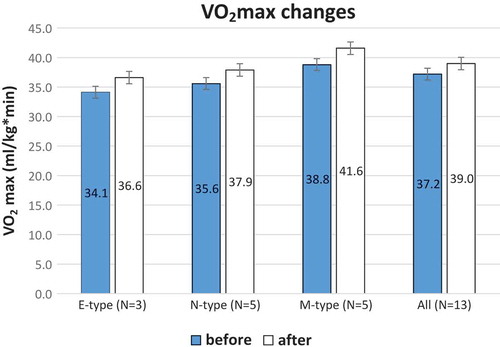
Figure 3. Scatter plot with trend line showing the relationship between the percentage change from start of VO2max as the dependent variable and the MEQ scores of the participants. MEQ score scale: E-type 16–41; N-type 42–58; M-type 59–86.
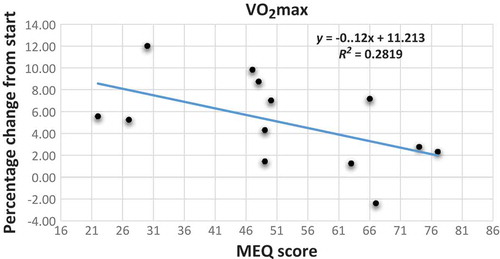
Table 1. Raw data for all the single participants (ID no.) before (pre) and after (post) the period of training.
Table 2. Raw data for all the single participants (ID no.) for different flexibility tests before (pre) and after (post) the period of training.
Table 3. Results from Pearson’s correlation analysis between the MEQ score (MEQ score scale: E-type 16–41; N-type 42–58; M-type 59–86) and changes in fitness variables after 10 weeks of training during polar night period at 70°N, expressed as percentage of change from pre-test score.
Figure 4. Scatter plot with trend line showing the relationship between the percentage change from start of strength index as the dependent variable and the MEQ scores of the participants. MEQ score scale: E-type 16–41; N-type 42–58; M-type 59–86.
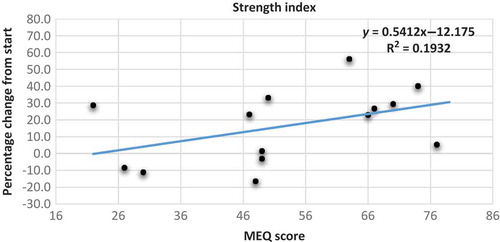
Figure 5. Scatter plot with trend line showing the relationship between the percentage change from start of the different flexibility tests as the dependent variable and the MEQ scores of the participants. MEQ score scale: E-type 16–41; N-type 42–58; M-type 59–86. Blue dot and line: percentage change for left side; orange dot and line: percentage change for right side; green dot and line: percentage change in sit and reach test; yellow dot and line: percentage change in flexibility index.
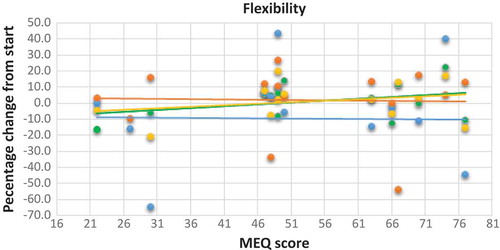
Figure 6. Scatter plot with trend line showing the relationship between the percentage change from start of balance as the dependent variable and the MEQ scores of the participants. MEQ score scale: E-type 16–41; N-type 42–58; M-type 59–86.
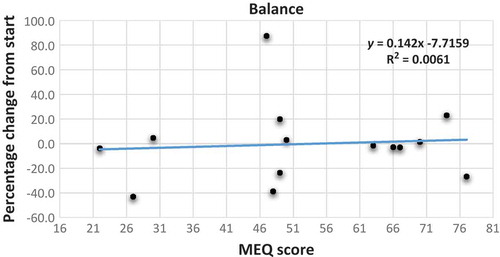
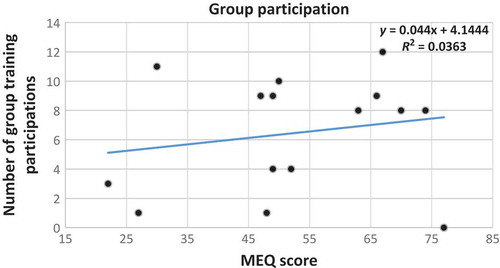
Figure 7. Scatter plot with trend line showing the relationship between the number of participants attending group training as the dependent variable and the MEQ scores of all of the participants.