
Figures & data
Figure 1. Study outline: Two 3-day diet intervention periods separated by one 7-day wash-out period. Participants had five visit days (blue). ✓ marks the main days a measurement or sample was taken, i.e. for most participants, and (✓) marks days the measurement/sample was taken, if not possible on the main day. *Dietary interview performed on one of the marked visits. **Oral sucrose tolerance test performed before day −7 for participants recruited by symptoms (unknown genotype).
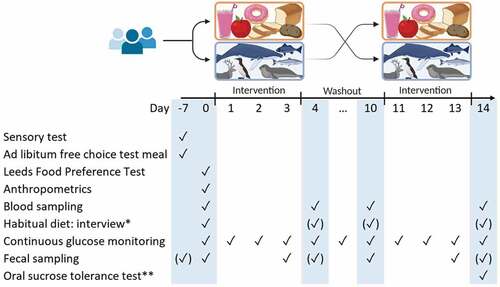
Table 1. Overview of fasting blood samples collected from each participant. All samples were collected at baseline. * Triglycerides, VLDL-, LDL-, HDL-, total and remnant cholesterol. ** At screening for participants from the open recruitment.
Supplemental material