Figures & data
Figure 1. Total White blood cell count in control and experimental groups.
Table 1. Differential white blood cell count in control and experimental groups.
Figure 2. Interferon gamma levels in control and experimental groups.
Figure 3. Tumor necrosis factor alpha (TNF-α) levels in control and experimental groups.
Figure 4. Immunoglobulin G levels in control and experimental groups. Data is Mean ± SEM n = 8, * indicates values that are significantly different compared to group II (p < 0.05); # indicates values that are significantly different compared to Group I (p < 0.05). I = Control, II = Control + ECIS, III = SD12 + ECIS, IV = SD96 + ECIS, V = DLR 12 + ECIS; VI = DLR96 + ECIS.
Figure 5. Immunoglobulin M levels in control and experimental groups. Data is Mean ± SEM n = 8, * indicates values that are significantly different compared to group II (p < 0.05); # indicates values that are significantly different compared to Group I (p < 0.05). I = Control, II = Control + ECIS, III = SD12 + ECIS, IV = SD96 + ECIS, V = DLR 12 + ECIS; VI = DLR96 + ECIS.
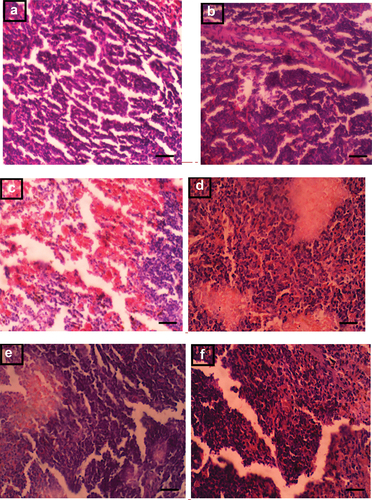
Figure 6. (A-F). Photomicrograph of the spleen in control and experimental groups (x400, Scale bar 50 μm).