Figures & data
Table 1. The animal grouping and treatment protocol.
Table 2. Primers sequences of genes analyzed by real time PCR.
Figure 1. The relative weight of the liver among different groups.
Figure 2. Photomicrographs of sections of liver showing a normal liver structure with hepatic strands (H) surround central veins (v) in the control mice. Sections of S. mansoni-infected mice showing a number of granuloma (G) with eggs (E). Sizes of the granuloma in IL-22 (0.36 µg/kg) treated groups appear smaller than the infected group (H&E, scale bar = 100 μm).
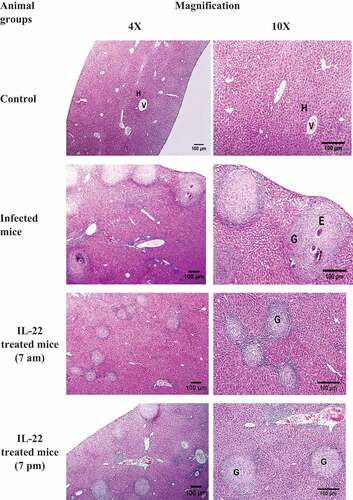
Figure 3. A photomicrograph of sections of infected liver showing a high magnification (400X) of granuloma (G) with central eggs (E), surrounded by fibro-collagen bundles entangling fibroblasts (arrows) and inflammatory cells (IC) (H&E, scale bar = 100 µm).
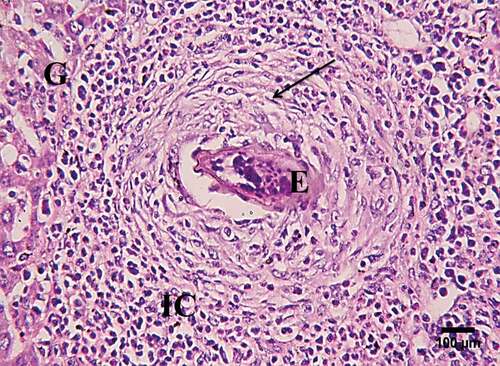
Figure 4. Granuloma index (GI) in the liver of S. mansoni-infected mice treated with IL-22 at 7 am or 7pm.
Figure 5. Serum cytokine level in S. mansoni-infected mice treated with IL-22 at 7 am or at 7pm. a: TNF-α (Tumor necrosis factor alpha), b: IL-17(Interleukin 17), c: IL-22 (Interleukin 22).
Figure 6. Serum IgE level in S. mansoni-infected mice treated with IL-22 at 7 am or at 7pm.
Figure 7. The expression level of mRNA STAT3 (a) and β-catenin (b) in S. mansoni-infected mice treated with IL-22 at 7 am or at 7 pm.