
Figures & data
Figure 1. Map showing the Eastern Region in Ghana and the excavation site.
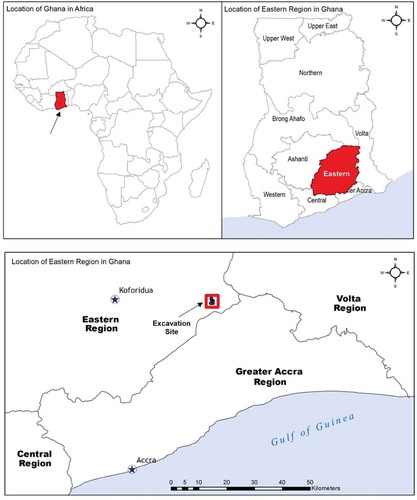
Figure 2. Map showing Klowem with the base area excavation units (South and North Trenches) and the hilltop excavation units. A ball clay placed on a bare rock of depth 240 cm below the Surface.
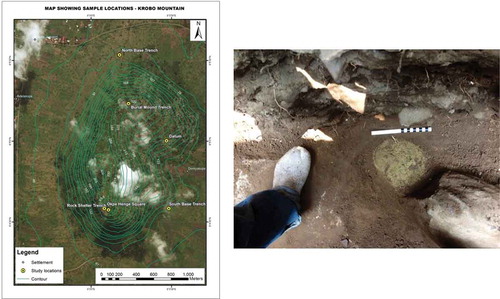
Figure 3. (a) TGA of KGC conducted in Nitrogen atmosphere, (b) FTIR of raw and calcined KGC (c)The calcined clay material at 600 deg revealing brownish coloration and (d) showing the colour of the raw clay.
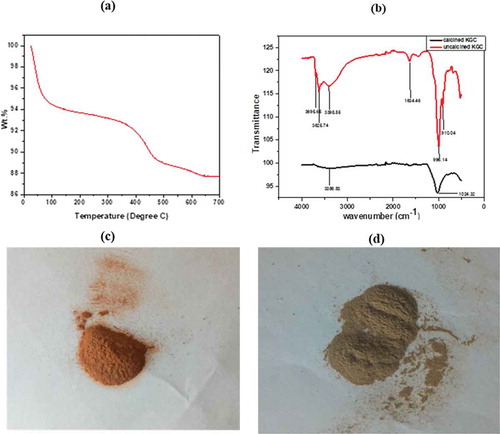
Figure 4. XRD patterns of the (a) raw clay at 25°C compared to the (b) calcined clay at 600°C. Additional peaks were observed in the calcined peaks probably showing an indication of a more crystalline material. (P: pyrophyllite, Q: Quartz, K: kaolinite). SEM of the raw clay at 25°C (c) compared to the calcined clay at 600°C (d).
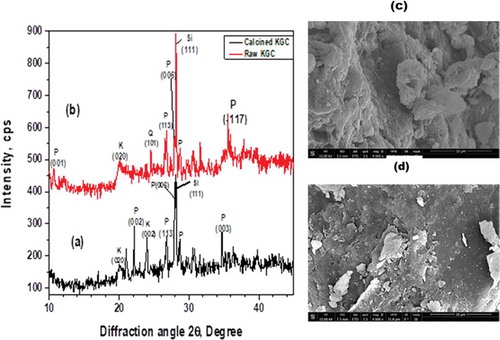
Figure 5. EDX analysis of the clay material showing the major elements and their corresponding intensities for the raw and calcined clay.
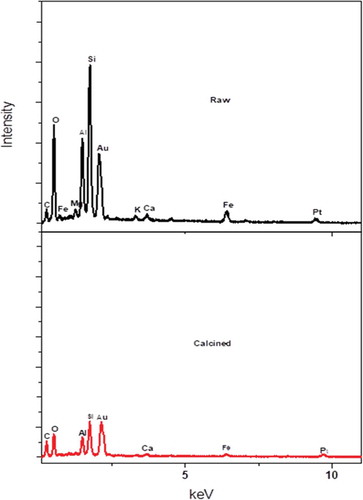
Figure 6. UV-VIS spectrophotometry analysis of methylene blue in 70 percent supernatant of ethanol from the raw clay material. (a) The corresponding absorption is recorded for 5 cycles of supernatant dissolution of the methylene blue. (b) Comparison of the adsorption of methylene blue when the supernatant from the raw and calcined clays are used to dissolve the dye, (c) UV-vis spectra for the adsorption of methylene blue by the raw clay sample and (d) an adsorption of methylene blue by the calcined clay at 600°C as a function of time at different concentrations.
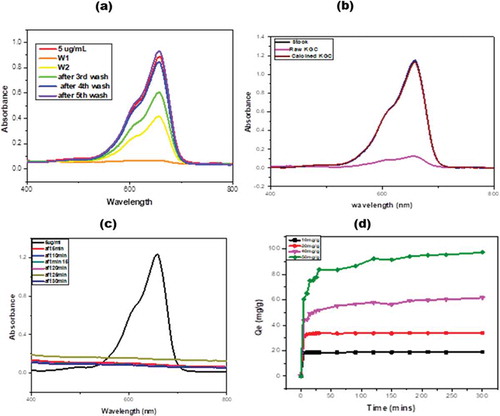
Table 1. The effect of change in methylene blue concentration after 300 minutes on the Calcined Clay
Table 2. Results showing the concentration of methylene blue in the clays and percent decolorization of the dye as well as the weight loss recorded at 25°C and 600°C
Figure 7. (a) The logistic and (b) ExpAssoc fit adsorption profile of methylene blue by calcined KGC paricles at different time intervals
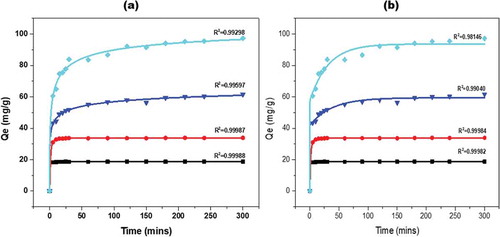
Figure 8. (a) Linearized Langmuir and Freundlich (b) isotherm, (c) Linearized pseudo-first-order and (d) pseudo-second-order kinetic model for methylene blue adsorption onto KGC.
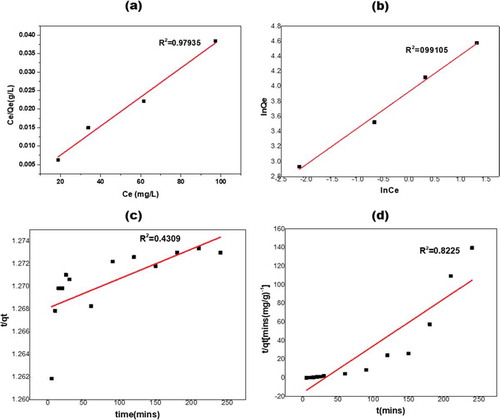
Figure 9. Linearized inter-particle diffusion model for methylene blue adsorption onto KGC.
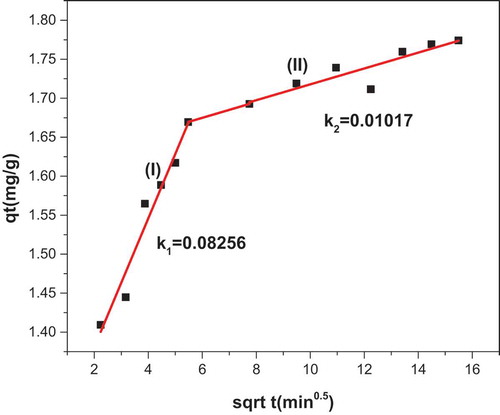
Figure 10. Absorption spectrum of concentration 50 mg/L (a) and 10 mg/L (b) showing the adsorption of MB onto KGC.
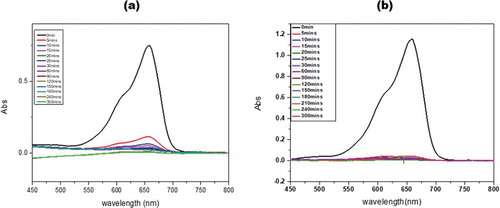
Table 3. Adsorption isotherm model parameters for the adsorption of MB onto KGC