7,707
Views
13
CrossRef citations to date
0
Altmetric
Research Article

Anti-hypertensive effect of Moringa oleifera Lam

& | (Reviewing editor)
Article: 1596526 | Received 11 Nov 2018, Accepted 12 Mar 2019, Published online: 03 Apr 2019

Figures & data

Figure 1. ACE inhibitory activity of EA extract purified by NP-VLC; Captopril was used as the positive control. The results were expressed as % of ACE inhibition with respect to the control. Each value was the mean of three independent determinations.

Figure 1. ACE inhibitory activity of EA extract purified by NP-VLC; Captopril was used as the positive control. The results were expressed as % of ACE inhibition with respect to the control. Each value was the mean of three independent determinations.

Figure 2. ACE inhibitory activity of ME-F1101 at different concentrations; Captopril was used as the positive control. The results were expressed as % of ACE inhibition with respect to the control. Each value was the mean of three independent determinations.

Figure 2. ACE inhibitory activity of ME-F1101 at different concentrations; Captopril was used as the positive control. The results were expressed as % of ACE inhibition with respect to the control. Each value was the mean of three independent determinations.

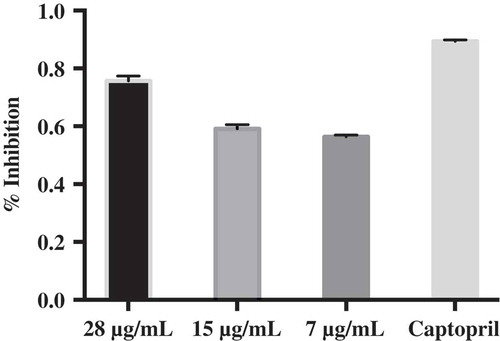
Table 1. Summary of 13C and 1H NMR data of 1

Table 2. 1HNMR data of isolated compounds

Figure 3. Structure of a flavonoid glycoside.

Figure 3. Structure of a flavonoid glycoside.

Figure 4. Systolic blood pressure (mm Hg) of mice treated with water (control, 1 ml/0.1kg/day, n = 5) or treated with L-NAME (30 mg/kg/day, n = 5). After the hypertension was established, a group of mice was treated with captopril (30 mg/kg/day, n = 5) as positive control group. Data are represented as means ± SEM. *Significantly different from the control group.

Figure 4. Systolic blood pressure (mm Hg) of mice treated with water (control, 1 ml/0.1kg/day, n = 5) or treated with L-NAME (30 mg/kg/day, n = 5). After the hypertension was established, a group of mice was treated with captopril (30 mg/kg/day, n = 5) as positive control group. Data are represented as means ± SEM. *Significantly different from the control group.

Figure 5. Systolic blood pressure (mm Hg) of mice treated with water (control, 1 ml/0.1 kg/day, n = 5) or treated with L-NAME (30 mg/kg/day, n = 5). After the hypertension was established, a group of mice was treated with ME (a) or EA (b) of M. oleifera (300 mg/kg/day, n = 5). Data are represented as means ± SEM. *Significantly different from L-NAME-treated mice.

Figure 5. Systolic blood pressure (mm Hg) of mice treated with water (control, 1 ml/0.1 kg/day, n = 5) or treated with L-NAME (30 mg/kg/day, n = 5). After the hypertension was established, a group of mice was treated with ME (a) or EA (b) of M. oleifera (300 mg/kg/day, n = 5). Data are represented as means ± SEM. *Significantly different from L-NAME-treated mice.

Figure 6. Systolic blood pressure (mm Hg) of mice treated with water (control, 1 ml/0.1 kg/day, n = 5) or treated with L-NAME (30 mg/kg/day, n = 5). Dose dependent studies of (a) ME-treated mice and (b) EA-treated mice. Data are represented as means ± SEM.

Figure 6. Systolic blood pressure (mm Hg) of mice treated with water (control, 1 ml/0.1 kg/day, n = 5) or treated with L-NAME (30 mg/kg/day, n = 5). Dose dependent studies of (a) ME-treated mice and (b) EA-treated mice. Data are represented as means ± SEM.